Altcoin Rally 2025: SUI, Fartcoin, and Other Cryptos Expected to Surge

Notable altcoins including Sui, Stacks (STX), and Fartcoin helped the cryptocurrency market kick off the week on a firm note Monday. It follows the introduction of fresh turbulence into U.S. financial markets around news that the Trump administration may seek to dismantle the Federal Reserve, including removing Fed chief Jerome Powell. That made currency markets quake, sending the U.S. Dollar Index (DXY), a key benchmark of the dollar’s strength versus six other most heavily traded currencies, to its lowest level in three years.
In this context, Bitcoin (BTC) has taken advantage of market jitters to push forward with its bullish trend, surpassing the $87.500 mark during Monday’s Asian trading session. The strength of Bitcoin’s shine was seen in the major altcoins including Ethereum (ETH), Ripple (XRP) and Solana (SOL), which also recorded gains as investor sentiment improved.
Market momentum suggests it is an emerging altcoin season, a phenomenon where the market can outperforms Bitcoin and grows more hectic. Observed surges often emanate from investor sentiment, emerging market dynamics or something working in an individual blockchain project.
Since the debut of Bitcoin Exchange Traded Funds (ETFs) in January 2024, BTC has continuously been leading the market share over altcoins, having a market share above 60%. At the time of writing, Bitcoin has 60.37% dominance over altcoins, which are 39.63% in total. Typically, altcoin seasons were associated with a decline of the BTC dominance as retail investors moved to new tokens like Sui, Stacks, and Fartcoin. This was recently altered by the arrival of ETFs as institutional and retail investors now prefer to hold BTC over alternative tokens.
Sui Eyes Breakout as Bulls Take Charge
Sui is a standout performer, with more than 7% daily gain attracting lots of attention. At time lock press time, the Layer 1 token trades for $2.26, having made a major bullish move since reaching April 7 low of $1.72. It seems that Sui is reversing its lengthy downtrend that started after Sui having recorded all-time high of $5.36 on January 4.
If the path of least resistance has indeed turned upward, the risk for the token is now trading above a key descending trendline. Several technical indicators are in line with this emerging trend. On the daily chart, the MACD is signaling a potential buy as the MACD line closes in on the neutral centerline and green histograms suggest some more upside. At the same time, the Relative Strength Index (RSI) is inching towards the upper and moving up towards it, indicating increasing bullishness on the part of market players.
Given the improvement of market conditions and the current positive bias of technical indicators, the focus has been shifted now to whether Sui can continue its bullish trend and keep its bullish position in the impending market rebound.
SUI, Stacks, and Fartcoin Show Mixed Technical Signals as Traders Weigh Next Moves
As SUI gains heft, traders watching the token are warned to be prepared for a variety of possible outcomes along the token’s key technical levels. The 50, 100, and 200-day Exponential Moving Averages (EMAs) of $2.41 and $2.74 respectively could very well become a resistance. In addition, a bearish crossover took place, the 100-day EMA fell below 200-day EMA — a classic warning sign indicating caution should be exercised before placing big bets on SUI long.
If the price falters and falls from the descending trendline, traders will keenly look at levels for possible rebound zones, at $1.80 marked in green on technical charts — and $1.50, which sat at September’s level.
Stacks Price Breaks Out, Verifies Bullish Pattern
On Monday, meanwhile Stacks (STX) rises to $0.70 after the token confirmed an inverse head and shoulders pattern, a typical bearish reversal setup that signals the end of a decline. The structure consists of a deeper deep ‘head’, and two shallower ‘shoulders’, and suggests further upside potential once it breaks out.
Buying orders should be set for traders to place slightly above the neckline resistance at $0.65, similarly to stop loss orders, set just below the nearest support of $0.65. Using the measured height of the pattern it is projected to climb another 27% to $0.83.
The bullish prediction also receives additional support from 4 hour chart 50, 100, 200 EMAs where STX is currently trading higher than and moving towards. Most of these signals imply that there is room for more gains but perhaps some caution. As the Relative Strength Index (RSI) has reached the overbought zone, the potential for a price pullback as sellers start appearing.
Fartcoin Battles for $1 Reclaim After Dip
After bouncing back from a weekend low, Fartcoin is once again pressing up near the key psychological $1.00 level once again. The meme token is now trading at $0.91, and has come back from the Saturday drop to $0.71, which was as low as it got after a drop that’s likely due to widespread profit taking activity.
Upwards momentum was renewed however and the dip was bought into. Now bulls have eyes on adding to the significant $1.00 mark. If this level is taken out, it would represent a major psychological and technical breakout for Fartcoin.
However, the current price structure of the meme coin is that of a cup and handle pattern — a bullish formation which was verified by breakout on April 9. To confirm bullish momentum, maintaining support above $0.90 is crucial since the price can be shunned by more buyers and upward pressure on the price can be pushed forward.
While the promising pattern and market atmosphere encourages the traders, analysts recommend caution. For the most part, meme coins are notorious for their high volatility and there is always still risk of potential drawdowns, even when rallying strong.
Bitcoin Reclaims Digital Gold Narrative as Market Turmoil Boosts Demand for Safe Havens
Interest in Bitcoin’s early narrative as ‘digital gold’ has been reignited after recent surging prices of gold and relatively strong performance of Bitcoin BTC/USD, 1hr against a broad based global market sell off. The comparison used to be a common one during the cryptocurrency’s early years, but has diminished lately only to start making headway again.
Bitcoin rose far above $87,000 during the Asian morning session, despite the macroeconomic uncertainty, indicating it is bullish. Some other big cryptocurrencies saw gains of up to 1.5% other major cryptocurrencies, like Cardano’s ADA, BNB Chain’s BNB, XRP and Ethereum’s ether (ETH). Losses accumulated since Thursday were erased by the upward momentum as Solana’s SOL climbed 5.2% over the past seven days.
Tensions as tariffs spur trade wars have resulted in a fear of inflation and currency devaluation. The market has spurs on new comparisons between Bitcoin and gold, the latter being the traditional hedge in uncertain times.
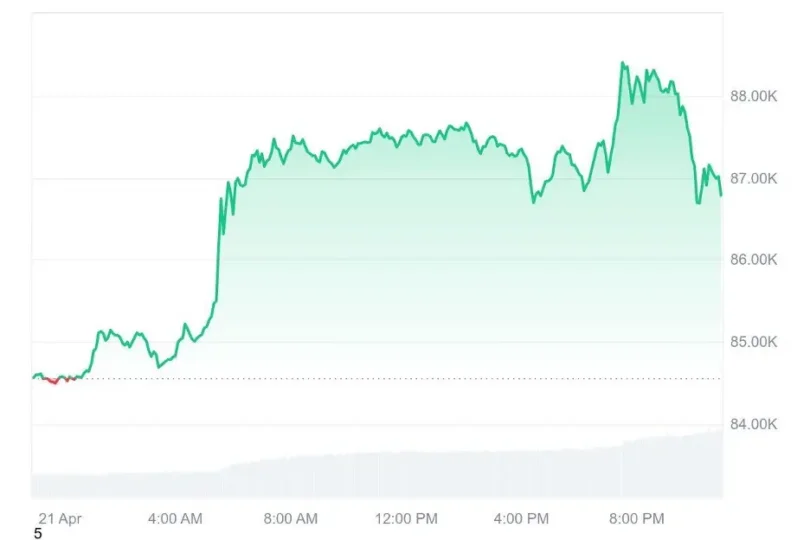
Gold prices hit a new all-time high Monday, rising above $3,380 per ounce for the first time and providing year to date gain of 25%. Although Bitcoin is down almost 20 percent from its January peak price of $108,000, it hit $87,000, the highest price since Trump’s so called “liberation day” early April.
On the other hand U.S. dollar continues to weaken. Sentiment that most of the macro economic negative factors have already been priced in to the asset prices was reinforced by the Dollar Index (DXY) dropping sharply to its lowest level in three years. This could pave for further upside in Bitcoin over the following days, they explain.
Cardano (ADA) Price Analysis
At the moment, the price of ADA is above $0.63 as strong technical signals indicate that Cardano’s ADA is expected to continue northbound despite the current challenging macro environment. Price has achieved clearly defined ascending channel and sound support at $0.612, a level that has done to date.
At 00:00 on April 21, 2025, trading volume spiked with 68 million, over 2x of the average. The momentum pushed the price over a key resistance point at $0.630. The next target by this analysis is 64 cents away, when we include an overall trading range of 0.031 (5.1%) which means very significant volatility.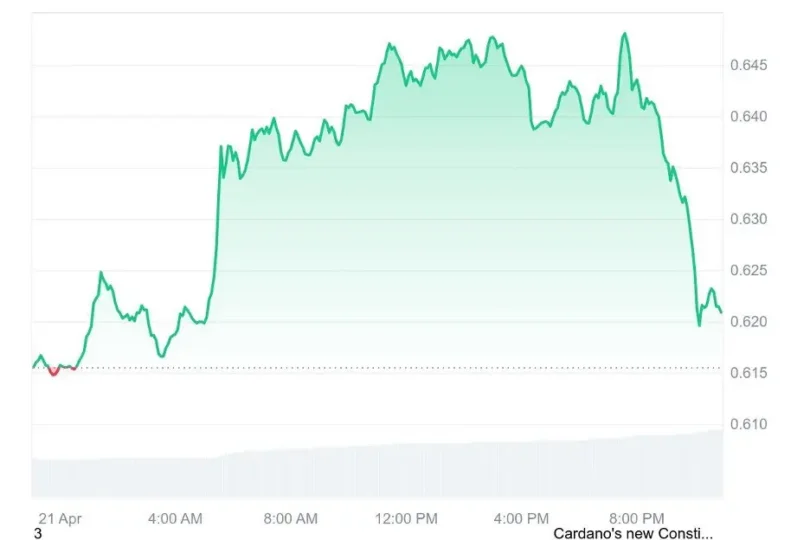
Although up, the Relative Strength Index (RSI) is still below the overbought threshold and has more room for appreciation. Since the current consolidation is taking place at previous resistance levels, this indicates accumulation as opposed to profit taking from or distribution.
XRP Price Analysis
A new trend is brewing in XRP’s sideways trading pattern, as XRP has now broken decisively out of this pattern. This momentum is backed up by technical indicators, which indicate that the Fibonnacci retracement levels should send momentum in the direction of the $2.15. If the bullish trend continues, the 61.8% Fibonacci extension level lies at $2.18.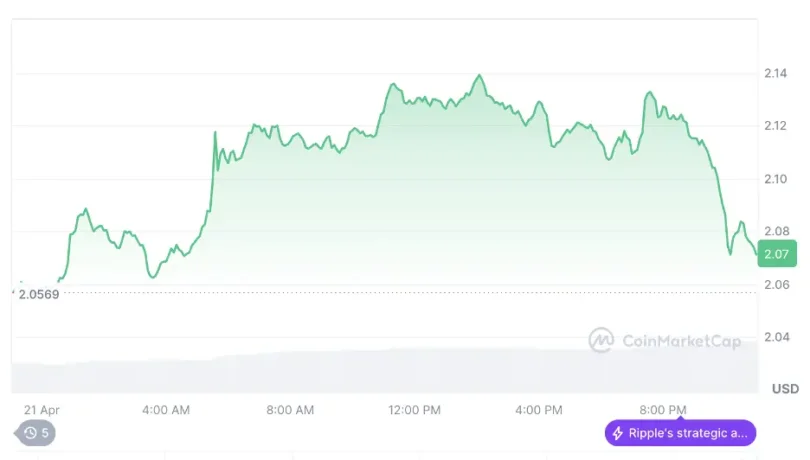
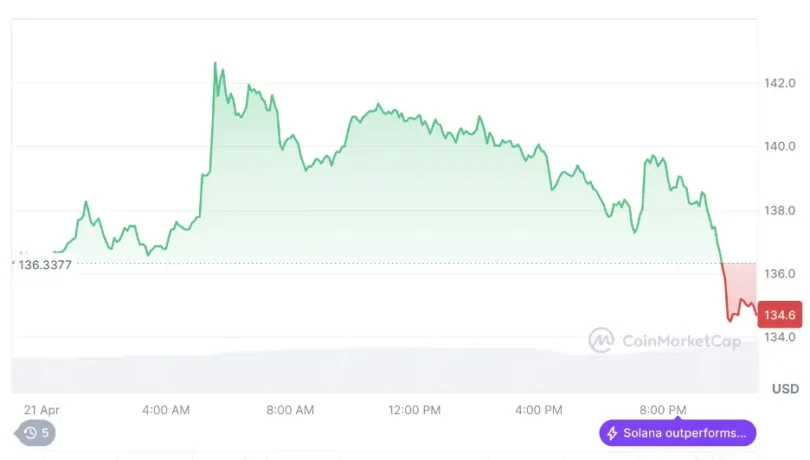
SOL Price Analysis
Solana (SOL) has decisively cracked through the $135 resistance level with a 10.2% climb and has itself solid support in the $131.5 range. The bullish outlook was backed strong volume. A key technical contest is now taking place between the $129 support and $144 resistance areas. Realized trading volume presents 5.75% of the volume in these zones.
Specifically, during the rally that began on April 19 and extended until April 21, the price follows an ascending channel running from low to high and high to low, i.e., higher highs and higher lows. During upward price moves Volume has consistently increased and this has led to a belief in the trend. Also, bullish divergence in 48 Hours momentum indicators shows price action staying above the 20 Hours moving average.
BNB Price Action
With the total number of BNB’s being over 1100 Mn, BNB has been able to break above the $600 mark with a 3.2% gain as overall market volatility increases and large holders accumulate BNB. The recent quarter token burn of 1.57 million BNB over $1 billion reduced further the support to price momentum.
Funding rates for BNB futures were still negative, leading to open interest increasing by 3.3% to $760 million, which indicates that 68% of traders were still expecting prices to rise. The token rallied from its recent consolidation range and broke out of it, as the token rose from $592.63 to $601.74 with some volume support.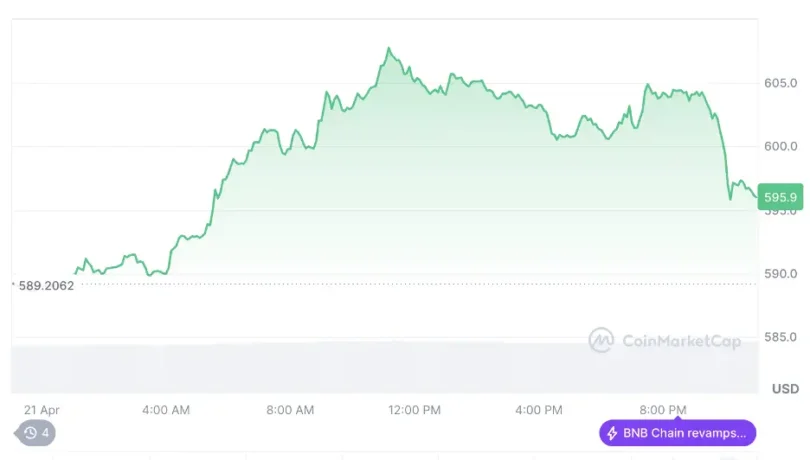
Volume went from 55,661 units in the breakout candle to 55,661 units. Fibonacci extension models indicate more price grows ahead, possibly culminating at about $605 to $610 with the current momentum.


