Bitcoin Breaks $116K, Ethereum Nears $4K, and Dogecoin Jumps 19% Amid Market Optimism

Bitcoin (BTC) looks set to finish the week higher after breaking the $116,000 resistance. Sentiment turned positive following U.S. President Donald Trump’s executive order that allows alternative assets, including cryptocurrencies, to be part of 401(k) retirement accounts.
Adding to the optimism, Japan’s SBI Holdings announced it has applied to launch a dual-asset cryptocurrency exchange-traded fund (ETF) that would provide exposure to both BTC and XRP.
Trump’s 401(k) Directive Boosts Bitcoin
BTC started the week with a mild recovery from last week’s decline. Sentiment picked up sharply on Thursday when Trump signed the order. The directive would allow retirement accounts to hold cryptocurrency, private equity, and real estate. This pushed BTC above the key $116,000 resistance.
Critics warned that putting volatile assets like crypto in retirement plans could bring instability. They also noted that the full details of the order are not yet public. The new rules would broaden eligible 401(k) holdings to include digital assets, gold, and private loans, alongside traditional stocks and bonds.
Meanwhile, stronger demand for stablecoins in China added to the positive tone. The Financial Times reported that China is preparing to launch its first stablecoins. This move is aimed at expanding the use of the yuan internationally and reducing reliance on the U.S. dollar for global trade.
Hong Kong, where the digital asset sector is legal, is expected to serve as the testing hub for this rollout. This follows recent regulatory approval for stablecoins in the city.
China’s interest comes soon after Trump introduced the first U.S. regulatory framework for stablecoins, the GENIUS Act. Analysts believe the growing involvement of both the U.S. and China in stablecoin adoption supports Bitcoin and other digital assets, since stablecoins are often used as a gateway into crypto.
September Rate Cut Expectations Add Support
BTC trading this week has been in a relatively narrow range with low volatility. Still, hopes that the U.S. Federal Reserve will cut rates in September have supported risk assets.
Data from the CME Group’s FedWatch Tool shows traders are pricing in about a 90% chance of a rate cut at the next policy meeting. Analysts expect at least two 25-basis-point cuts before the year ends.
Tariffs Create New Market Risks
Market sentiment faced fresh uncertainty after Trump announced new tariffs. He raised duties on Indian imports to 50% in response to India’s purchases of Russian oil. Trump also said tariffs on semiconductors and pharmaceuticals would be coming soon. These measures could create more volatility in global markets, including crypto.
SBI Holdings confirmed in its Q2 2025 earnings report that it has filed for a BTC and XRP ETF in Japan’s markets. If approved, this could increase institutional exposure to the two assets.
Optimism also grew after the U.S. Securities and Exchange Commission (SEC) clarified earlier this week that crypto liquid staking services are not considered securities offerings. SEC Chair Paul Atkins said the agency remains committed to giving clearer rules on how existing securities laws apply to crypto.
BTC Price Outlook
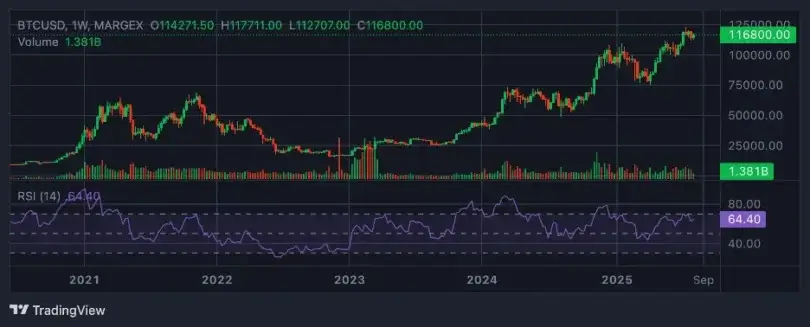
Bitcoin ended Thursday above the $116,000 support level and traded around $116,800 on Friday afternoon. Analysts say holding above this level could lead to a push toward $120,000. A close above that mark could see BTC test its July 14 all-time high of $123,218.
Technical indicators are turning positive. The Relative Strength Index (RSI) moved above the neutral 50 mark on Thursday and is now at 64, suggesting bearish pressure is easing. Analysts add that RSI needs to keep rising to sustain the bullish case.
The Moving Average Convergence Divergence (MACD) lines are closing in on each other on the daily chart. The shrinking red histogram bar below the neutral line suggests selling pressure is dropping.
However, if BTC fails to hold $116,000, it could drop toward its 50-day exponential moving average (EMA) at $113,422.
Ethereum Gains Nearly 3% as Crypto Market Recovers
According to analyst Ali Martinez’s post on X, Ethereum’s native token, ETH, rose 2.89% on Wednesday to $3,826.99 against Tether USD (USDT).
Ethereum, the second-largest cryptocurrency by market cap, has shown strong resilience over the past year. Charts show a sharp recovery that began in late 2024. From lows near $2,250 in September 2024, ETH has gained over 70% to its current level.
After a major drop to around $1,500 in early 2025, seen by many traders as capitulation, Ethereum began a steady climb. The recovery has brought it back near past cycle highs.
Ethereum’s recent history shows high volatility. In 2024, the price topped $4,000 multiple times, followed by consolidations that tested investor patience. Each pullback brought new buying interest, showing strong demand for the smart contract platform’s token.
At $3,826.99, ETH is close to the $4,000 resistance level. Traders will watch this mark closely, as a break above could start a fresh move higher in the ongoing bull market.
Ethereum’s price often signals the direction of the altcoin market because of its central role in DeFi and NFT ecosystems. The current strength suggests rising confidence in blockchain applications and smart contract use.
A long-term chart by Mister Crypto shows clear market cycles. ETH went from under $20 in 2016 to nearly $1,400 in early 2018, a 7,000% surge. The bear market that followed pushed prices to around $80 by late 2018.
The 2020–2021 cycle saw ETH rise from pandemic lows of about $100 to an all-time high of over $4,800. This 4,700% gain was supported by institutional interest, the growth of DeFi, and the NFT boom.
After a correction to around $880 in 2022, ETH began its current recovery phase. Prices are now near $4,000, with the potential to set new records.
Technical analysis shows higher lows in each cycle, a sign of growing demand and acceptance. Corrections have been less severe over time, pointing to market maturity. Key accumulation points in past cycles have been highly profitable for patient investors.
ETH is now trading between support at $3,500 and resistance at $4,000. Traders are watching for catalysts that could move the price in either direction.
Dogecoin Shows Bullish Momentum
Dogecoin (DOGE) maintained a strong bullish tone on Friday, extending its rebound from the $0.1881 support level with a gain of nearly 19%, reaching around $0.2232 at press time.
The rally mirrors broader gains across the cryptocurrency market, driven by a shift toward risk-on sentiment. The meme coin segment is also advancing, with total market capitalization climbing more than 6% in the past 24 hours to roughly $77 billion.
Data from derivatives markets signals an increase in speculative activity. However, the rise in the proportion of Dogecoin’s supply currently in profit raises the possibility of early profit-taking, which could slow momentum.
According to CoinGlass figures, open interest in Dogecoin futures and options the notional value of outstanding contracts has grown 6.6% in the past day to $3.4 billion. Trading volume has also climbed to $6.5 billion, reflecting strong speculative interest and active participation from traders.
If the current technical setup holds and retail demand remains consistent, analysts suggest DOGE could aim for its July high of $0.2871.
Dogecoin Bulls Stay in Charge
DOGE trades well above its 50-day EMA. It also has confluence support from the 200-day EMA at about $0.2075 and the 100-day EMA near $0.2033.
The RSI is above the midpoint, backing the view of continued buying pressure. The MACD is nearing a bullish crossover. This would be confirmed if the blue line moves above the red signal line on the daily chart.
Key support to watch includes $0.2200, the EMA zone near $0.2075, and $0.1881, last tested on Sunday. Resistance is expected at $0.2317 from May 27, $0.2594 from May 11, and the July high of $0.2871.


