Bitcoin Dips Below $67K, Overheated Ethereum Futures, and XRP Down 2% Despite Uphold Support

Bitcoin (BTC) is down on Tuesday after returning to around $70,000 earlier on Monday.
Nevertheless, the institutional investors took the opportunity, as US Spot Exchange Traded Funds (ETFs) registered more than $297 million. Due to the lack of short-term driving forces, market conditions for the week upswing are projected to fluctuate highly in the cryptocurrency market.
On Monday, institutional investors capitalised on the free fall in Bitcoin prices, whereby Coinglass ETF data demonstrated that US spot ETFs registered a net inflow of $297.60 million. This increase was mainly attributed to its (BlackRock’s, IBIT) funds, with an inflow of $332.30 million.
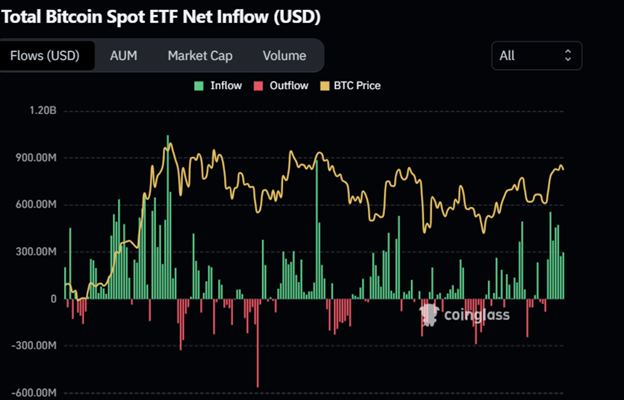
This is the seventh day of inflows in a row now. If this trend continues, it could strengthen the recent rally in Bitcoin prices.
The Santiment’s Network Realized Profit/Loss (NPL) suggests the details of the causes of the recent declines. The NPL indicator computes daily ROI for the network and transmits this data based on the count of coin transactions on the blockchain.
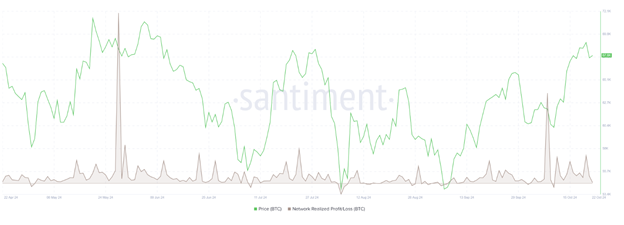
Holders are seen to sell at a profit when there is a V-shaped strong upturn in NPL. In contrast, a sharp downturn indicates investors selling their stocks at a loss, often due to panic.
BTC showed the same fluctuation. Between Saturday and Sunday, the NPL indicator rose from 348.87 million to 1.64 billion, suggesting that many people were selling to book their profits.
Bitcoin Price Forecast: Struggling to Break $70,000
Bitcoin has pulled back 2.4% to $65,874 on Monday and has primary support around the critical level of $70,000. We are now trading on early Tuesday, and overall, Bitcoin remains moderately below while trading at around $67,100.
If the Bitcoin price were to sustain its current path below $70,000, the next support level to be tested would be $66,000.
Other features likely to reflect vulnerability can also be observed based on technical factors. The RSI on the daily Bitcoin chart is 60, coming down after being rejected from the overbought region of 70.
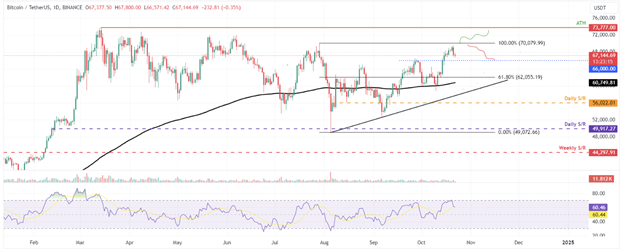
Leveraging observations on relative accordance may indicate a deceleration in instances of bullish staking. If the RSI goes below 50, the coin is oversold, and a drop in the Bitcoin value can be more profound.
On the upside, the BTC price may surge towards the retest of the $70,079 level before aiming for another barrier at $73,777, BTC’s record high, set mid-this year.
Impact of ETF Outflows on Ethereum’s Market Dynamics
Ethereum (ETH) fell for the second consecutive session on Tuesday after being rebuffed by nearly $2,700 on Monday.
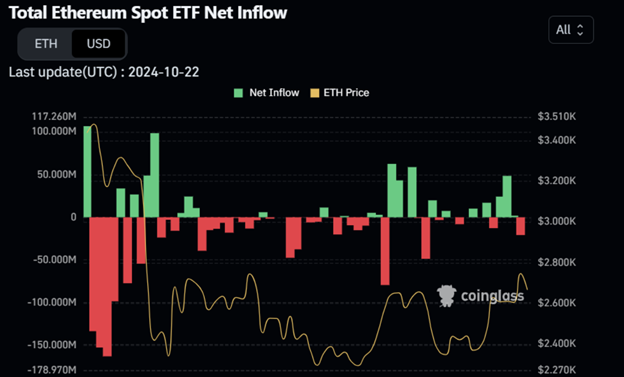
This decline was alongside a moderate outflow of over $20 million from spot Ethereum exchange-traded funds (ETFs) in the United States. Besides, the ETH futures market Estimated Leverage Ratio (ELR) has elevated so that a short-squeeze situation may occur.
According to CryptoQuant, Ethereum may face a short squeeze as the ELR rises to 0.39, its highest level since early July. Higher numbers reflect that more traders are borrowing financial instruments to sell short, a bearish view.
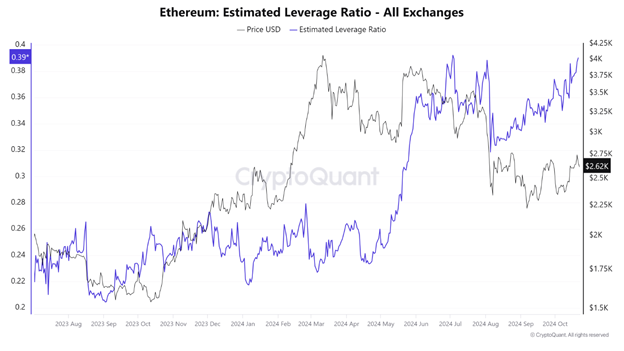
Since Ethereum’s price has been in a downtrend and the increased ELR has been noted, one can deduce that the futures market may very well be overextended. This leaves Ethereum open to a short squeeze, whereby mass selling triggered by the forced liquidation of users who had taken on short positions could be followed by frantic buying if the price starts to rise unexpectedly.
Even institutional activity has decelerated this week; according to Coinglass data, a minor outflow of $20.80 million from the US spot Ethereum ETF on Monday.
On this front, CryptoQuant’s Ethereum Coinbase Premium Index looks bearish and still below the neutral zone.
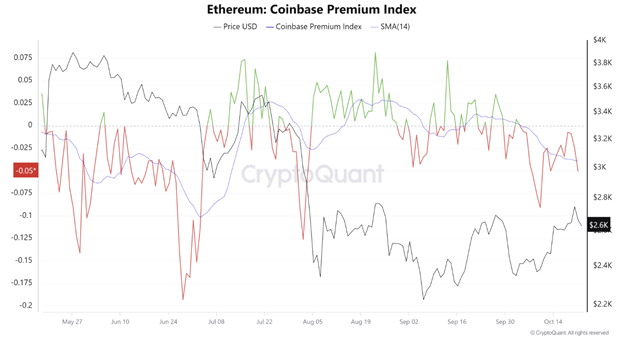
As such, the index, which is a differential between the price of the USD pair in Coinbase Pro and the USDT pair in Binance, is a crucial variable, observing the large-wallet buyers – particularly those whales in accumulation mode.
This is especially true considering that Coinbase Pro is one of the key platforms through which institutional investors procure cryptocurrencies.
Ethereum Price Forecast: Signs of Weakness Emerge
On Monday, Ethereum could again not break through support at the descending trendline created by connecting several peaks since the May 23 high. According to Bloomberg data, The cryptocurrency slid 2.9% on the day by market close. Tuesday breaks down, and Ethereum remains weak, with the price hovering around $2,600.
If Ethereum is to extend the decline, more declines may follow to reach the daily support level of $2,461 again.
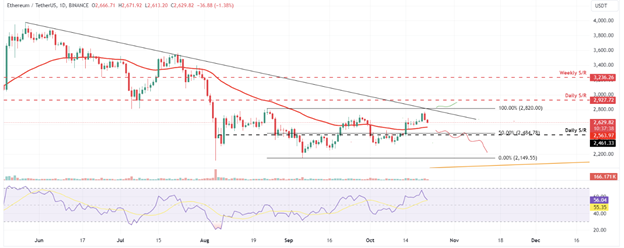
One has the Relative Strength Index, a momentum indicator currently standing at 56 and running downwards on the daily graph after being rejected at the 70 overbought territory. This indicates a decline in this type of bullish pressure. If RSI goes below the neutral 50 level and decreases, a more significant Ethereum price drop is possible.
On the other hand, if the price edged above the mentioned descending trend line and formed a daily close above $2,820, it might start a rally and retest the next daily resistance level, located at $2,927.
Ethereum’s Price Performance and Market Standing
Ethereum’s YTD percentage has decreased to 13%; it was closing in at 20% only a few days back. While less active now and having relatively low utilisation rates compared to its earlier performance, Ethereum is still one of the market leaders, with a market capitalisation of $316.5 billion. This puts it in an excellent position to be number two behind Bitcoin in the list of popular cryptocurrencies.
Ethereum’s total cryptocurrency market capitalization is 316.5 billion dollars, which, when added to Bitcoin (BTC) ‘s 1.15 trillion dollars, represents about 68% of the crypto market.
This dominion was even more dramatic at Ethereum’s ATH market capitalisation of $571 billion on November 9, 2021. While ETH’s market cap is half of what it was at its peak, it remains significantly more extensive than rivals Solana (SOL) and Ripple (XRP), both of which have caps of around $78 billion and $30 billion, respectively.
As the public stops caring about ether and shifts their attention to other programs, Ethereum maintains a solid 24-hour volume of roughly $16.9 billion. The largest share of this number is the world’s popular exchange called Binance, which shares approximately 11% of the total.
Conversely, other leading exchanges like OKX or Bitget. Subsequently, trading activity by SOL, XRP, and BNB is at least seven times lower than Ethereum.
Ethereum’s Transition to Proof-of-Stake
Ethereum has had some upgrades, but the London hard fork is significant as it altered ETH’s blockchain from PoW to PoS.
Although this change elicited a negative response, particularly from miners, the upgrade has significantly enhanced transaction velocity, reducing network costs. Nevertheless, some customers are still dissatisfied with the PoS. The Ethereum co-founder recently defended the system on X (formerly Twitter) by pointing out how PoS is more decentralised than PoW.
What’s Going in Ripple?
On Tuesday, 22nd October, Ripple (XRP) fell nearly 2%, which caused its holders to start questioning the altcoin’s future. The Ripple market focuses on a court case, its partnership with the SEC, and the potential of Ripple USD (RLUSD), a stablecoin.
At the recent Swell 2024 event, additional exchange partners were disclosed, and while the company teased the potential of RLUSD, its release date was not specified. Focus has now shifted to the SEC appeal against the ruling of the Ripple lawsuit, the Ripple appeal, and Bitwise’s pending XRP ETF application.
XRP Price Analysis
Since hitting the high of $0.7440 on March 11th, Ripple (XRP) has been subject to a slump, and the altcoin may continue down the trend. It remains under downward pressure toward $0.50, which is nestled in an imbalance range of $0.4780-$0.5136 on the XRP/USDT daily chart.
XRP’s downside was further seen at 6.43%. The first level of potential buying pressure was seen at $0.5138, which was the recent high of XRP noted on 6 August.
The Relative Strength Index is at 43 when writing this article, which is below the midpoint of 50. It’s further declining, which is evidence of bearish sentiment in the token’s price trend.
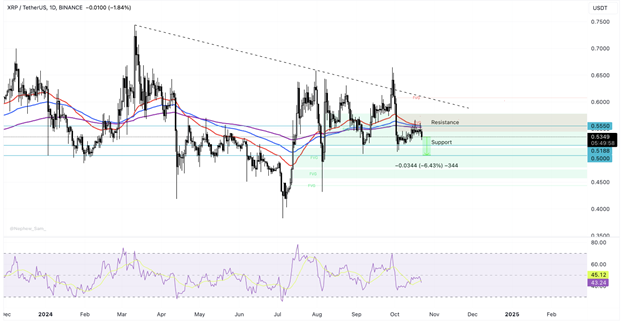
However, the bearish outlook is violated if the price closes daily above the $0.6000 resistance level. If so, XRP might reprobe the lower border of the imbalance zone at $0.6069.
During Ripple Swell 2024, the company’s leading annual conference, Ripple announced several important initiatives, including a list of exchange partners and their functions and further information on its upcoming stablecoin.
However, Ripple USD has no specific beginning date on the market. However, some exchange partners, such as Uphold, have expressed their interest in the altcoin and have stated their intentions of listing the altcoin on their platforms.
XRP’s demand should improve with the release of Ripple’s stablecoin. Ripple President Monica Long pointed out that the internal currency was set to gain from the adoption, which could be a potential positive driver for use.
Similarly, Bitwise’s application for an XRP ETF may receive more movements depending on how the outcomes of the U.S. presidential election in the country would turn out. Nate Geraci, the President of the ETF Store, noted that Solana and XRP ETFs’ approval will not be possible if Kamala Harris becomes president.


