Bitcoin Dips, Dogecoin & Shiba Inu Flash Bullish

Friday saw Bitcoin’s price stay around $106,000 after it went through a correction that reduced its value by nearly 3% this week. Advanced analytics have revealed that a lot of traders are cashing out their profits after the price went down which was not observed recently.
According to on-chain analysis, some of the selling behind this market correction is coming from people who are trading only for short-term gains. On Tuesday, the NPL score rose sharply which was the most active profit realization this week since February 5. On Friday as well, a weaker spike in cases was observed. As these indicators reveal, more investors are profiting from sales of bitcoin which is leading to lower prices.
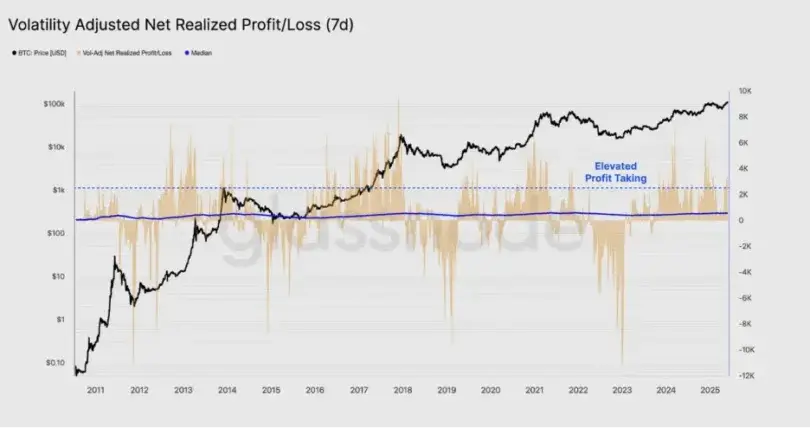
In the latest report, Glassnode points out that investors’ profitability and activity are both on the rise. Still, the current market levels are not as high as they were at the peaks of previous bull runs. The report also covers the Volatility-Adjusted Net Realized Profit/Loss which adjusts Bitcoin’s profit or loss for the seven-day market fluctuation and its increasing capitalization. This means that while BTC has been profitable lately, it has dipped below its previous record far more than it has grown. This is an indication of increased selling, just not to the extreme.
Although there are frequent changes, more and more major institutions are interested in Bitcoin. The fact that major firms are holding Bitcoin in their treasuries signifies they keep trusting in its long-term value.
MicroStrategy which is now known as Strategy, purchased $427.1 million of BTC on Monday, totaling 4,020 BTC. After making this acquisition, the company owns 580,250 BTC.
It is the first time that GameStop has purchased Bitcoins as it works to change its treasury plan. On Thursday, Metaplanet from Japan said it would issue $21 million in Ordinary Bonds for further Bitcoin investments. Recently, the firm’s total Bitcoin holdings reached 7,800; this number is up from the 7,600 BTC it had the previous day.
By recent actions, these companies are showing that Bitcoin is being accepted more and more as a smart treasury asset. More and more investors are putting their money into spot Bitcoin ETFs which proves that the cryptocurrency is widely accepted by institutions, regardless of short-term changes in prices.
The data from SoSoValue shows that U.S. spot Bitcoin ETFs which are mostly made up of institutional money, received a total of $458.82 million this week. For three weeks now, foreign investors have been injecting funds into Chinese stocks. The total value of ETFs purchased in May reached $5.85 billion which was the best monthly figure recorded since last December. If this trend carries on or picks up, the experts believe Bitcoin could rise and try to break the record set in 2017.
Bitcoin Struggles to Rebound Despite Easing Tariff Concerns
Bitcoin started the week in a good position after Trump said on Truth Social on Monday that he was delaying the implementation of a 50% tariff on EU goods from June 1 to July 9. The decline came a day after Trump announced that he would impose high tariffs on products coming from the EU because of no progress in talks at the EU headquarters which led Bitcoin to fall by 3.9%.
The extension of the tariff deadline modestly lifted market sentiment, prompting a mild rebound in Bitcoin, which closed above $109,000 on Monday. However, this recovery proved short-lived.
On Wednesday, the U.S. Court of International Trade added to the case by issuing a ban on Trump’s big round of reciprocal tariffs introduced earlier this year. The court stated that the President went beyond his powers in adding strict requirements for U.S. trading partners’ goods. New orders needed to be given by a three-judge panel in ten days, in accordance with what was decided by the court. The Trump administration has appealed the decision following the administration’s decision.
Most markets were positive about the court’s ruling, as the U.S. dollar rose and worldwide equities went up from the hope that trade issues were getting settled. On Wednesday, Bitcoin saw a fall and closed beneath $105,600 the day after, even though it had hit an all-time record of $111,980 just a short time before.
Macroeconomic Data Weighs on Risk Appetite
Key indicators from the U.S. this week failed to give support to risk assets. The minutes from the Federal Reserve’s recent May meeting discussed the fact that economic conditions are still uncertain. It was recognized by the group that balancing challenges could arise should inflation remain a challenge, while growth and jobs prospects go down.
On Thursday, investors became more negative after the economic numbers were not very favorable. Sales of homes that are under contract plummeted to the lowest level seen in a year, reaching a fall of -6.3% and there were also more initial jobless claims, up from the previous week by more than expected to 240,000. Besides, the first-quarter GDP decreased by 0.2% compared to the previous year which adds to concerns about the economy.
Bitcoin Technical Indicators Show Waning Bullish Momentum
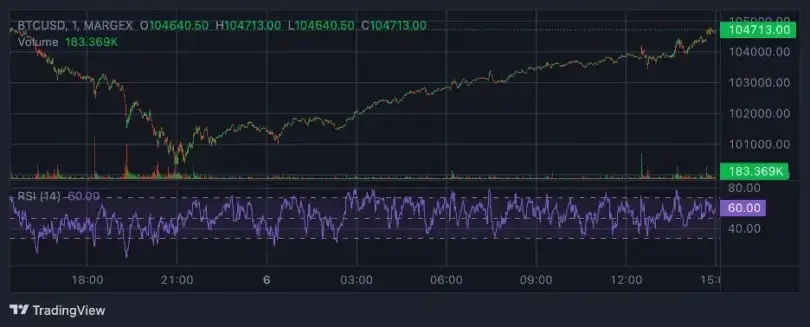
Bitcoin’s upward trend seems to be calming down. On Thursday, the cryptocurrency fell below its key support of $106,406 due to ongoing correction. There was a slight decline in BTC values by Friday morning which were just above $106,000.
If the trend continues, analysts believe Bitcoin may drop as low as $100,000 again. The RSI value for the daily chart is now at 54, moving toward the level of 50 which indicates buying power is decreasing. The MACD indicates a bearish crossover, as red bars that expand below the black line are found on the chart, suggesting the price could drop more.
Nevertheless, if Bitcoin powers back above its previous high and closes above it daily, this could again encourage investors to buy and cause the asset to reach the $120,000 level.
In the market for meme coins, a 5% fall was observed, yet Dogecoin and Shiba Inu show signs of an uptrend within a falling wedge pattern. There has been a more than 5% fall in the total value of meme coins over the last 24 hours and they are now sitting at $56.34 billion.
Leading cryptos like Dogecoin (DOGE) and Shiba Inu (SHIB) kept declining inside falling wedge structures which have often been followed by upward price movements. Although the market is weakening right now, there are signs from both technical signals and derivatives data of a possible quick improvement.
Dogecoin and Shiba Inu Mirror Market Moves
Currently, Dogecoin is up nearly 3% and now costs $0.1763. This happens after a nearly 10% fall seen on Thursday. The falling wedge formation now seems to be encouraging a bullish reversal by the meme coin.
This wedge is marked by a declining resistance line that goes through the tops on May 23, May 25, and June 5 and a rising support line formed by the bottoms on May 20, May 31 and June 5. They usually point to a coming point where the market takes a breakout from the range.
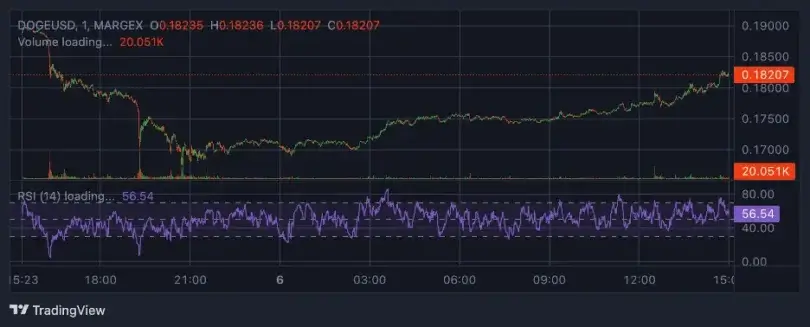
The Relative Strength Index (RSI) on Dogecoin’s 4-hour chart currently stands at 32, rising above the oversold region and forming a higher low relative to previous price bottoms on May 31 and June 5. This bullish divergence between RSI and price supports the case for an impending rebound.
If the bullish momentum continues, Dogecoin will need to close above the descending trendline near the $0.1832 resistance level. A successful breakout could lead to further gains, with resistance expected at the 50-day Exponential Moving Average (EMA) at $0.1946 and the 200-day EMA at $0.2039. Conversely, a failure to reverse could see the token test support at $0.1642, which marks the low from May 6.
Shiba Inu Eyes Recovery Amid Falling Wedge Pattern
Shiba Inu is moving in the same direction, reporting a 3% gain to quote at $0.00001238 on Friday. The modest rise in the market is happening after the 6.32% drop from yesterday. Just as DOGE, SHIB is now within a falling wedge, one marked by high points seen on May 23, May 29, and June 5 and accompanied by lows on May 13, May 19, and May 31.
A 4-hour reading of the RSI for SHIB now stands at 37, moving SHIB outside the place where it was oversold. In addition, the RSI has formed higher lows as the price dropped over these five days which is more evidence of a bullish divergence.
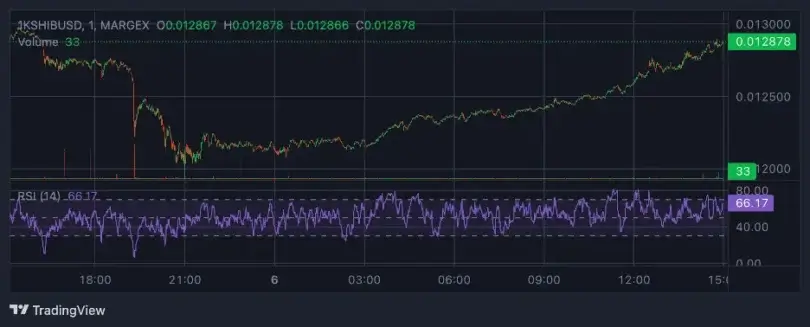
If SHIB continues to rise, the price may reach $0.00001280 which is the same as Thursday’s opening value. After breaking this level, traders could face resistance at the 50-day EMA which is set at $0.00001306 and the 200-day EMA, found at $0.00001375. Even so, if the trend continues going down, SHIB could retest its $0.00001159 support level seen on April 16.
Derivative Market Dynamics Reflect Shifting Sentiment
Based on Coinglass figures, in the last 12 hours, Dogecoin experienced $1.13 million in short liquidations and $183,000 in long liquidations, much less than the $23.78 million in long liquidations and $3.42 million in short liquidations that were seen in the previous 24-hour period. There are fewer bullish exits now which is seen in less long liquidations, but this caused the long/short ratio to drop to 0.9194 due to more short positions.
Also, the amount of Open Interest (OI) in Dogecoin has gone down by 6.31% to $1.94 billion which shows that traders are moving away from the derivatives market.
Shiba Inu has experienced a similar trend. Its Open Interest declined by 11%, dropping to $143.26 million. The funding rate for SHIB also flipped positive, now standing at 0.0035%, reinforcing the growing bullish undertone.
Liquidation figures for SHIB underscore the trend. Long liquidations have dropped from $718,000 over the past 24 hours to less than $800 in the last 12 hours. However, short liquidations remain comparatively elevated, totaling $14,850 over 12 hours and $50,690 in the broader 24-hour window.
These shifts in both spot and derivatives markets highlight a tentative transition in trader sentiment, potentially setting the stage for a short-term rebound in meme coin prices despite broader market weakness.


