Bitcoin Drops Below $111,600 as Whale Selling

Bitcoin (BTC) continued to move lower at the start of the week. The price slipped below $111,600 on Monday after facing rejection from a broken trendline last week. The leading cryptocurrency has now corrected almost 10% from its record high. This happened even though Federal Reserve Chair Jerome Powell gave dovish remarks during his Jackson Hole Symposium speech on Friday.
Selling by large whales and institutions, combined with over $1 billion in spot Bitcoin ETF outflows, added further weight on the market.
Correction Extends Despite Powell’s Policy Statement
Bitcoin dropped by more than 3% last week and touched a low of $110,680 on Sunday. This decline came despite Powell announcing that the Fed is moving to a new policy framework. The central bank will now follow flexible inflation targeting and leave behind the previous “makeup” inflation approach. Powell said the new framework calls for balance when the Fed’s goals are in conflict.
CoinGlass liquidation data shows the scale of the sell-off. Within 24 hours, 164,852 traders were liquidated, with losses exceeding $807.54 million. Bitcoin alone made up nearly $250 million of these liquidations. More than 94.95% were long positions, reflecting overstretched bullish bets. The single largest liquidation took place on OKX, where a BTC/USDT position worth $12.49 million was closed.
Whale and Institutional Moves Deepen the Decline
Data from Lookonchain revealed a major Bitcoin wallet, which once received 100,784 BTC valued today at $11.4 billion, started moving funds into Ethereum. Over five days, the wallet deposited 22,769 BTC worth $2.59 billion to Hyperliquid for selling. At the same time, it bought 472,920 ETH valued at $2.22 billion. Analysts believe this selling was a direct factor in Bitcoin’s recent correction.
Institutional activity also weighed heavily. According to SoSoValue, spot Bitcoin ETFs recorded outflows of $1.17 billion last week. This was the largest weekly withdrawal since March. Analysts warn that outflows of this scale can drive deeper corrections in BTC’s price.
Despite the sell-offs, some moves showed continued confidence in Bitcoin. Japanese firm Metaplanet confirmed on Monday that it added 103 BTC to its holdings. This brought its total to 18,991 BTC. The purchase highlights ongoing corporate interest in Bitcoin despite price volatility.
Santiment data also pointed to recovery potential. Its 30-day Market Value to Realized Value (MVRV) metric stood at -3.37% on Monday. Historically, reversals often happen when MVRV nears -4%. Analysts said this means Bitcoin is undervalued at current levels, with most short-term holders sitting on paper losses.
Bitcoin Key Support and Resistance Levels
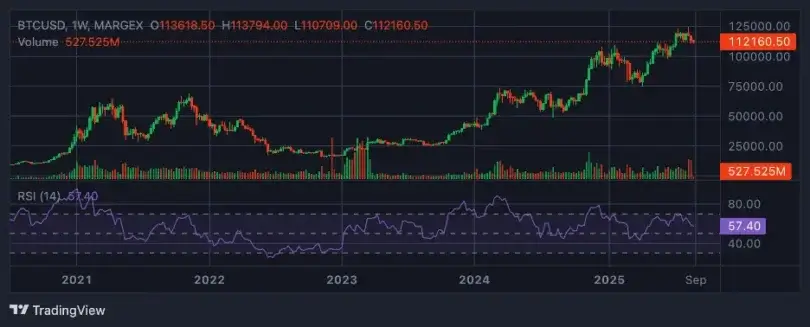
On Friday, Bitcoin bounced from the 100-day Exponential Moving Average (EMA) and gained almost 4%. But it lost steam, facing rejection from its broken trendline on Saturday, before sliding another 3.42% into Sunday. By Monday, BTC was trading slightly lower at $111,501.
If Bitcoin closes below the 100-day EMA at $110,865, analysts expect a deeper slide toward the 200-day EMA near $103,688. Technical indicators are still bearish. The Relative Strength Index (RSI) is at 57. The Moving Average Convergence Divergence (MACD) also turned bearish last week.
If support around the 100-day EMA holds and Bitcoin rebounds, the price could retest resistance at $116,000.
Solana Holds Above $207 as Open Interest Hits Record Levels
Solana (SOL) remained positive above $207 on Monday. The price built on last week’s strong rally. Sentiment was boosted by record Open Interest (OI) on SOL futures, which crossed $13 billion. Optimism also rose after last week’s IPO by Bullish. Analysts said the event may give Solana the momentum to retest its all-time high.
CoinGlass reported Solana’s futures OI reached $13.08 billion on Monday, marking a new record. Rising OI often signals new money flowing into the market and stronger buying activity. This trend may support further gains in SOL’s price.
Trading activity also increased on-chain. Data from Artemis Terminal showed decentralized exchange (DEX) volume on Solana rose sharply. It moved from $2.6 billion on August 17 to $7.1 billion by Sunday. Analysts said this reflects rising engagement with the ecosystem.
Momentum in Solana strengthened after a series of updates last week. Bullish (BLSH), a global platform for digital asset trading and data, said it raised $1.15 billion from its IPO in the U.S. Most of the funds came in stablecoins minted on the Solana network, adding more demand for the blockchain.
Other drivers also emerged. Solana will feature at the All-In Summit 2025 in September. Superteam UAE announced “Solana City,” a coworking hub in Dubai. Meanwhile, Wyoming confirmed the launch of the first stablecoin issued by a U.S. state, set to run on Solana. Analysts viewed these developments as signs of wider adoption.
Solana Price Analysis
Technical signals favor a bullish case. On Friday, SOL found support at its 50-day EMA near $179.45. It then rallied almost 16% into Sunday. By Monday, the price held above $207, maintaining upward momentum.
If the current move continues, SOL could test resistance around $230. A close above that level may open the path toward its record high of $295.83.
The daily RSI stood at 62, well above neutral, showing strong buying. The MACD also showed a bullish crossover last Friday. Both signals add strength to the positive outlook. Still, analysts said any pullback could take SOL back toward its 50-day EMA at $179.45.
Cardano Price Bounces From Support as Open Interest Climbs
Cardano (ADA) showed signs of recovery after rebounding from a major support level last week. Rising Open Interest and growth in stablecoin market capitalization backed the move. Technical indicators also suggest bearish momentum is easing, leaving room for a possible rally.
CoinGlass reported that Cardano’s futures OI rose from $1.54 billion on Friday to $1.77 billion by Monday. This brought it closer to the record $1.87 billion. Rising OI usually signals fresh money entering the market and new long positions, which may support ADA’s rebound.
Figures from DefiLlama showed Cardano’s stablecoin market capitalization has been climbing since late July. By Monday, it reached $38.58 million. Analysts see this as a positive sign, as growing stablecoin use often means stronger network activity and adoption.
Cardano Price Outlook: Support Holds, Resistance in Sight
On August 13, ADA broke above a descending trendline formed since December. The move sparked a rally that briefly pushed the price to the $1 mark the next day. But momentum faded, and ADA fell 5.4% last week before bouncing from trendline support. This support level aligns with the 61.8% Fibonacci retracement at $0.82, marking it as key. By Monday, ADA traded near $0.92.
If momentum holds, ADA could retest its August 14 peak of $1.02. A daily close above that could pave the way toward its yearly high of $1.17.
The RSI stood at 58, above the neutral 50 level, showing bullish momentum. The MACD showed lines converging, reflecting uncertainty among traders. On the downside, analysts said ADA could still pull back toward $0.84 if selling pressure returns.


