Bitcoin Drops Below $116,000 as Market Awaits Fed and Geopolitical Signals

Bitcoin (BTC) slipped under $116,000 on Monday, pulling back from last week’s record of $124,474. The drop came as hopes for a Federal Reserve rate cut eased, with recent U.S. economic data showing mixed signals. Traders also kept a close eye on political events, including a meeting between Ukrainian President Volodymyr Zelenskyy and U.S. President Donald Trump scheduled later in the day.
Geopolitical Talks Add to Market Caution
Bitcoin’s retreat followed its sharp rally to new highs. The focus shifted toward talks in Washington, where Trump was expected to meet both Zelenskyy and European Union leaders. The discussions were expected to cover possible steps toward resolving the conflict in Ukraine.
The White House talks came after Trump met with Russian President Vladimir Putin in Alaska on Friday. U.S. envoy Steve Witkoff said both sides agreed that Washington would provide security guarantees to Kyiv.
Ahead of Monday’s session, investors turned defensive. The wider crypto market opened lower, with BTC sliding below $116,000 in early trading. Analysts said any breakthrough in peace talks could lift market sentiment, which might also help Bitcoin and other risk assets rebound.
| Day | Minimum Price | Average Price | Maximum Price |
|---|
Fed Cut Optimism Fades After Inflation Data
Recent U.S. macro numbers have been the main driver of Bitcoin’s volatility. Softer-than-expected Consumer Price Index (CPI) figures earlier last week supported bets on a September rate cut. That optimism pushed BTC to its record high of $124,474 on Thursday.
But the mood shifted after stronger Producer Price Index (PPI) data showed inflationary pressure remained. This reduced the odds of a larger 50-basis-point cut and triggered risk-off moves across markets. According to CME’s FedWatch tool, the chance of a 25-basis-point cut now stands at 84.8%, down from 98% a week earlier.
CMB International Securities, part of China Merchants Bank, announced on Monday that it launched a regulated virtual asset trading service in Hong Kong. The platform allows trading in Bitcoin, Ethereum (ETH), and Tether (USDT).
It is the first such service by a brokerage tied to a Chinese bank operating under Hong Kong’s framework. Analysts view this as a positive signal for the long-term adoption of digital assets, especially with the region’s authorities continuing to push pro-crypto policies.
Institutional Demand Continues Despite Market Pullback
Japanese investment firm Metaplanet disclosed on Monday the purchase of an additional 775 BTC, raising its total holdings to 18,888 BTC. The acquisition underscores growing institutional adoption, even amid short-term price weakness.
Data from SoSoValue shows that institutional net inflows reached $547.82 million last week, up from $246.75 million the previous week but below levels recorded in mid-July. Analysts suggest that sustained inflows will be necessary for Bitcoin to regain upward momentum.
Despite this institutional activity, derivatives markets indicate rising caution. CoinGlass data shows Bitcoin’s long-to-short ratio at 0.85 on Monday, the lowest level in over a month. A reading below one point to bearish positioning, with more traders betting on price declines in the short term.
Bitcoin Nears Key Support
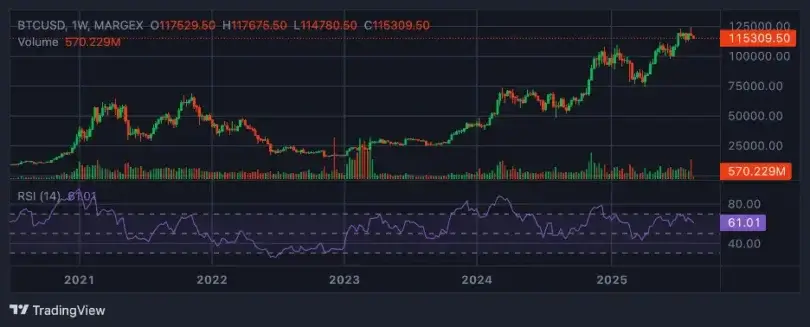
Bitcoin’s rally to $124,474 last Thursday was followed by a 4% intraday drop. Over the weekend, it hovered near $117,300 before falling further on Monday. The coin is now testing support close to its 50-day Exponential Moving Average (EMA) at $115,010.
Indicators show weakening momentum. The Relative Strength Index (RSI) moved towards the neutral 50 mark, pointing to growing bullish momentum. The Moving Average Convergence Divergence (MACD) posted a bearish crossover on Sunday, adding to sell signals.
If BTC closes below the 50-day EMA and its rising trendline from April lows, analysts warn it could fall further to support near $111,980. A rebound above $116,000, however, may give bulls a chance to push toward $120,000, a level seen as major resistance.
XRP Technical Setup Points to Deeper Correction
XRP’s daily chart is forming an Elliott Wave structure, according to analyst “Charting Guy.” He said the recent bounce was corrective rather than impulsive, suggesting a deeper C-wave decline is likely. That move could revisit August’s lows.
He explained on X that the August rebound from $2.72 to $3.38 was a three-wave corrective rally, unlike other impulsive five-wave moves. In his view, it was a B wave, and a C wave is likely to complete the correction that began in late July.
His annotated XRP/USD chart showed wave 1 and wave 2 forming in May and June, followed by a strong wave-3 rally in mid-July. Since then, the pair has been in an A-B-C correction forming wave 4.
The A leg pulled back sharply from the July high. The B wave recovery peaked near $3.40. The ongoing C leg is projected to extend toward the August low. At Monday’s daily close, XRP traded at $3.02881, between the 0.786 and 0.888 Fibonacci retracement levels.
Fibonacci Levels Mark Key Zones
Charting Guy’s analysis focuses on Fibonacci retracements and extensions. His retracement levels start with 0 at $1.61184, followed by 0.136 at $1.78405, 0.236 at $1.92231, and 0.382 at $2.14363. The 0.5 midpoint sits at $2.34100, with further retracements at 0.618 ($2.55653), 0.702 ($2.72195), and 0.786 ($2.87293).
Higher levels include 0.888 at $3.1273 and 1.000 at $3.4000. These mark the resistance zone XRP must break to confirm the correction is over. Above those, possible targets for wave 5 stand at 1.272 ($4.16533), 1.414 ($4.63105), and 1.618 ($5.39272).
The B-wave recovery stalled below the $3.1273–$3.4000 resistance band, reinforcing the idea that XRP needs a breakout to start the next advance.
C-Wave Target Area
The projected end of the C wave is framed by the 0.786–0.702–0.618 cluster at $2.87293, $2.72195, and $2.55653. The August low of $2.72 is highlighted as a likely anchor.
A descending trendline from the wave-3 peak intersects the A-B-C structure, suggesting a possible finish near the “4” marker before a fresh rally. The “5” marker is placed near the 1.414 extension at $4.63105, with $5.39272 seen as a stretch target if momentum strengthens.
When asked about his earlier $8 target, Charting Guy responded: “Is there anywhere in the post that says no more $8 target?” On the chance of an extended run in November, he replied: “Maybe. Maybe.”
He also reminded readers that the downside is not guaranteed: “dips are never guaranteed even if they seem likely.” He added that long-term holders may prefer to hold, while traders can use futures, options, or spot positions for short-term strategies.
XRP Price Analysis
For now, XRP needs to reclaim and hold above $3.1273 and $3.4000 to avoid another retest of the $2.72 floor. A break above resistance would open the door to wave-5 targets between $4.16533 and $4.63105, with $5.39272 flagged as a possible extended objective into late September or early October.
Worldcoin Faces Risk-Off Sentiment with OI Drop
The Open Interest (OI) of futures of Worldcoin, i.e., the notional value of outstanding futures contracts or options, is now 38 percent down from its July high of 465 million. The value continues to retreat to the current value of 287 million, marking a decline in risk-on appetite as fewer traders are betting on a price reversal in the short term. According to the analysts, provided this trend continues unchanged, chances of WLD regaining prices beyond 1.00 can be left wanting.
Parallel to it, the number of liquidations has risen. In the last 24 hours, the overall liquidation came to 2.12 million, with long positions contributing a total of 2 million in that amount. The imbalance also underscores the market bearish momentum that exists.
However, there is something to look forward to in spite of the crash. As observed by market observers, a trend reversal may arise in case the futures weighted funding rate continues its positive direction. A high funding rate generally serves as an indication that there are more traders who are supporting long positions, and this might substantially improve the probability of a near-term improvement.
WLD Price Outlook
With a view to being technical speaking, Worldcoin is trading on thin ice, and even a buy at $1.00 seems weak against the backdrop of a larger risk-off tone in the cryptocurrency marketplace. The token is trading below significant moving averages, such as the 50-day, 100-day, and 200-day Exponential moving averages (EMAs) that converge around 1.04. This cross in resistance provides an extra burden on the bulls as they seek to support this level.
Indicators of momentum contribute to the rather pessimistic perspective. The Moving Average Convergence Divergence (MACD) indicates a bearish sign, adding to the fears of a further fall to lows at the $0.90 support level. The MACD line is still below the signal line; the bearish bias is in effect.
In the meantime, the Relative Tightness Index (RSI) shows up and drops into the oversold area, which indicates decreasing purchase force.


