Bitcoin Eyes $120K Again, Ethereum Shows Big-Money Moves and BONK Hits $2.5B Market Cap

Bitcoin is showing signs of recovery again. On Wednesday, it climbed back above $118,790 during the European session. This bounce follows a nearly 2% drop the previous day. The shift in price reflects renewed hope in the market. Two major developments are behind the optimism: a new push for crypto-friendly laws in the US and a surge in institutional investment.
Early Wednesday morning, US President Donald Trump shared a post on Truth Social. He said the GENIUS Act is ready to advance through the House of Representatives during the legislative “Crypto Week.” Trump explained that he met in the Oval Office with 11 of the 12 lawmakers needed for the vote. They agreed to support the measure in a Thursday morning session.
This comes just after a setback on Tuesday. Lawmakers failed to approve a motion that would have let three bills, GENIUS, CLARITY, and the Anti-CBDC Surveillance State Act, move forward. The vote failed 196 to 223. Some Republicans joined Democrats to block it.
Even so, Trump’s statement gave the market new hope. It raised expectations that the crypto industry might get clearer rules soon. If things move fast, the bills could land on the President’s desk before Congress begins its August break. “Crypto Week” is now a key focus. It includes debate on the GENIUS Act, the CLARITY bill, and the Anti-CBDC legislation. The entire industry is watching closely.
At the same time, major investors are stepping in. Data from SoSoValue shows that spot Bitcoin ETFs had $402.99 million in net inflows on Tuesday. That marks the ninth day in a row of positive flows, a trend that began on July 2. The steady buying suggests that institutional players are getting more confident as regulation improves.
More signs of this trend appeared on Wednesday. Bitcoin For Corporations reported that Cantor Fitzgerald is wrapping up a $4 billion SPAC deal with Adam Back, CEO of Blockstream. The goal? To acquire more than 30,000 BTC. That’s a large move by traditional finance into crypto.
Meanwhile, Standard Chartered announced it has launched spot trading services for both Bitcoin and Ethereum. The offering is targeted at institutional clients, further signaling mainstream acceptance of digital assets.
After falling to $115,736 on Tuesday, Bitcoin found support. It had just hit a new all-time high of $123,218 on Monday. Now, it’s hovering around $119,000. The modest bounce shows some resilience after the dip.
Looking at the bigger picture, Bitcoin is still trending upward. Since June 23, it has gained nearly 18%. That’s three solid weeks of gains. But analysts warn that sharp gains often lead to corrections. If a correction comes, Bitcoin could pull back to $111,980, its previous all-time high from May 22.
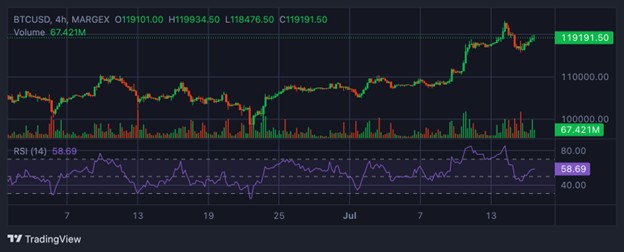
In the case of consolidation, Bitcoin may trade between $111,980 and $120,000 for a while. If BTC manages to close a daily candle above $120,000, it could retest the $123,218 level and possibly push even higher.
Market indicators support this outlook. The Relative Strength Index (RSI) is at58and rising. That suggests more room for upward movement. But if RSI drops back toward 50 or lower, it might hint at a short-term pullback.
Looking ahead, a report from K33 Research offers some insights. It studied past bull cycles. The findings show that Bitcoin peaked 1,062 days after the bottom in 2021 and 1,069 days after the bottom in 2017. If this pattern holds, the current cycle could top out between October 15 and October 30 this year.
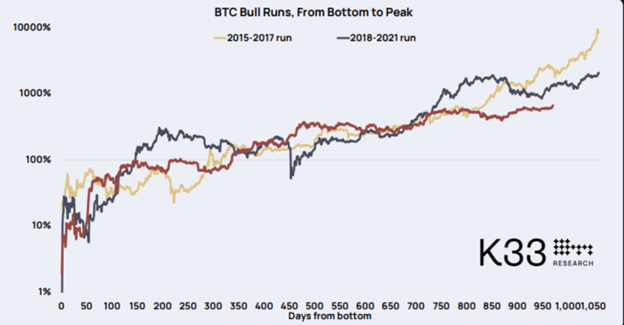
However, the report also notes that we may not see an exact repeat of past trends. This time, several new factors are in play. The halving effect is weaker. At the same time, long-term trends like regulation and national-level adoption are gaining ground. These shifts could change how this cycle plays out.
As Bitcoin sits near $119,000, both legislation and large-scale buying remain in focus. These two elements are likely to shape the next major move in the crypto market.
Retail Investors Are Coming Back, On-Chain Data Shows
There’s another sign that the market may be turning. Top analyst Axel Adler points to a shift in on-chain activity. The 30-day change in demand for small transfer volumes $0 to $10,000 has turned positive. It’s the first time in several months this metric has risen.
Small transfers often represent retail users. This metric turning positive suggests that everyday investors are getting back in the game. The return of these smaller holders could mean rising confidence at the grassroots level.
Retail investors matter. While institutions may start big moves, retail activity helps keep trends alive. Adler explained that a rally needs broad support. Without it, gains can fade quickly. “Retail participation is essential for maintaining upward momentum,” he said.
The return of small-scale transactions is happening at a time when Bitcoin is testing major levels. Many see this as a sign that a more stable recovery could be building. It’s not just about price anymore. It’s about growing belief in Bitcoin’s long-term role, even with all the ups and downs.
Ethereum Breaks Out After Long Stagnation, Analysts See Institutional Backing
Ethereum is also making waves. It has broken out of a long consolidation range, moving through a thin liquidity zone with strength. This sudden surge is getting attention.
Crypto analyst Cazz posted on X, noting that the ETH/USD pair has finally left its 8-week sideways range. Volume was high, and weekly candles closed near the top of their range. These are signs of serious buying pressure.
Cazz said this kind of move suggests big players are involved. He pointed out that when prices move quickly through areas with low liquidity, it often means institutions are buying. That’s because retail investors rarely generate that much momentum on their own.
He added that Ethereum’s structure looks strong. Technical signals are matching up with bigger trends. “This is classic big money behavior,” he wrote.
At the same time, Solana seems to be struggling. The SOL/ETH chart shows weakness. Solana is losing key support levels on the weekly timeframe. While Solana might still get some short-term gains, it’s no longer leading the market. Ethereum appears to be taking the lead again.
According to Cazz, Ethereum is now emerging as the Layer 1 network preferred by institutions. He said the last year of sideways action likely reflected accumulation by large holders. Now that fundamentals are improving, ETH may be entering a new phase.
These fundamentals include things like tokenized treasuries, real-world assets (RWAs), and a more developed DeFi ecosystem. Together, they add up to stronger use cases and wider appeal.
Cazz also noticed a resurgence in Ethereum-related memes. This may sound trivial, but it points to renewed engagement from the community. These cultural signals often align with major market shifts. It’s another piece of the puzzle showing ETH might be stepping into a stronger role.
Bonk (BONK) Leads Meme Coin Surge with 12% Daily Jump, Gains 110% in 30 Days
Bonk (BONK) is leading the meme coin charge. On Wednesday, it surged over 12% in a single day. It’s now trading close to $0.00003377. Over the last 30 days, the token is up by 110%.
CoinGecko data shows that Bonk’s market cap has increased by 55% since July began. It now stands at around $2.55 billion.
 аб
аб
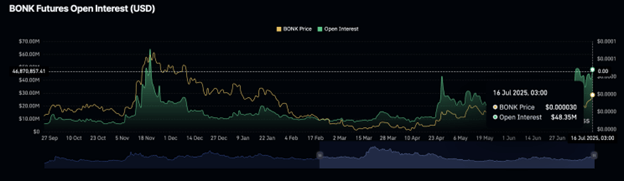
The price jump is backed by real interest, especially in the derivatives market. According to CoinGlass, Bonk’s futures Open Interest (OI) has averaged $48 million since early July. OI tracks the total value of open futures and options contracts. A rise in OI means traders are engaging more with the asset.
Volume in Bonk derivatives is also up. It has jumped from $39 million to $618 million. That’s a huge leap. The simultaneous rise in volume and OI suggests traders are confident and willing to take on more risk.
If momentum keeps up, Bonk could test resistance at $0.00004000. If it breaks through, the next level might be $0.00005000.
Technical Indicators Stay Strong for Bonk
Bonk has been in the green for five days straight. The MACD indicator has been flashing a buy signal since June 28. The MACD line is above the signal line, and green bars on the histogram are still above zero. This setup usually supports long positions.
On top of that, Bonk saw a Golden Cross over the weekend. This happens when the 50-day Exponential Moving Average (EMA) rises above the 100-day EMA. Traders view this as a strong sign that the trend is up.
Because of this, many expect Bonk to keep pushing higher, as long as the derivatives market stays active.
Even with all the bullish signals, caution is still needed. Bonk’s RSI is in the overbought zone. This means the token may be due for a pullback or at least a pause.
Traders should keep an eye on the RSI. If it starts moving toward the middle of the range, that could signal falling momentum and less buying pressure.
Support Levels to Watch
If Bonk pulls back, these are the key levels to watch:
- $0.00003000: Last tested in December.
- $0.00001935: A support zone where the 50-day and 200-day EMAs intersect.
Despite some signs of overheating, Bonk remains one of the top-performing meme coins right now. Strong derivatives activity and technical support are keeping it in play. Both short-term traders and longer-term speculators are watching closely.


