Bitcoin Surpasses $112K to Set New All-Time High as Altcoins Join the Bullish Surge

Key Takeaways:
- Bitcoin hit a new all-time high of $111,999 in July after a strong rebound from April lows near $74,500.
- Wave analysis suggests BTC is in the final leg of a bullish cycle, with a potential target near $237K.
- Market optimism is partly driven by Trump’s tariff policy, which positions Bitcoin as a safe-haven asset.
- ETF inflows for Bitcoin have cooled, while Ethereum ETFs continue to attract strong interest, with $4.51B in total inflows.
- XRP surged past $2.37 after announcing BNY Mellon as custodian for its stablecoin RLUSD; technicals point to a target near $2.76.
- Dogecoin is showing bullish breakout signals, supported by Fibonacci levels and Elliott Wave analysis, possibly entering a new upward wave.
Bitcoin had a rough start in 2025. It dropped more than 30% and touched $74,500 in April. But things changed quickly. Since then, it has bounced back with strength and gained serious momentum.
In May, Bitcoin reached a new all-time high of $111,980. After that, the price corrected itself and dipped to $98,200. That correction continued into June, where Bitcoin hovered around $98,240. This was close to falling below a key support zone around $104,000. There were also fears that the long-term support at $140,000 might not hold, since it had been considered a major point in the chart’s history.
Still, Bitcoin didn’t stay down for long. In the last week of June, it made a solid comeback. It formed what’s known as a bullish engulfing candlestick, which usually means a shift in direction. That move wiped out fears of a bigger fall. And in July, the rally picked up again. On July 9, Bitcoin reached a fresh peak of $112,000.
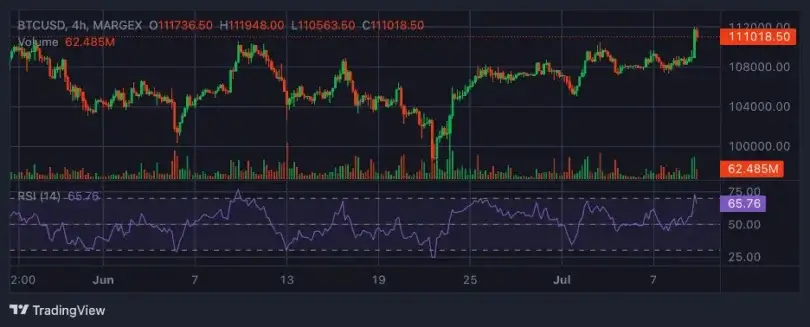
Now that it’s in new territory, traders are looking at technical signals to guess what could happen next. One level that stands out is $131,000. This comes from the 1.61 external Fibonacci retracement level, which is often used in price predictions. But that’s just a starting point. A closer look at Bitcoin’s wave count could offer better insight into its long-term path.
According to wave theory, Bitcoin is currently in the fifth and final wave of an upward cycle that began in December 2022. This wave is stretched out and includes several sub-waves. These sub-waves are marked in black and orange lines on charts. Although different wave forms can appear like expanding or contracting shapes, the strong upward pattern suggests that this final wave might keep extending.
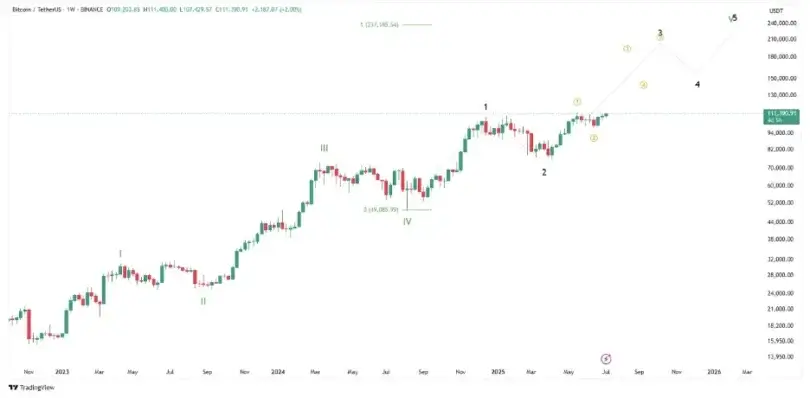
Based on this wave count, the next big target for Bitcoin could be around $237,185. This estimate assumes wave five will match the combined length of waves one and three. If that plays out, the technical outlook for Bitcoin in the short term remains positive. Many investors expect further gains as the months go on.
Bitcoin’s new peak also came shortly after US President Donald Trump released a new set of tariffs. These tariffs imposed duties as high as 40% on imports from countries like Malaysia, Kazakhstan, South Africa, Myanmar, and Laos. Japan’s tariffs were raised to 25%. These changes will go into effect on August 1.
Katalin Tischhauser, Head of Research at Sygnum Bank, linked Bitcoin’s strong momentum to its new role as a safe-haven asset. She noted that this trend started around April 2, the date Trump called his “Liberation Day.” Since then, Bitcoin exchange reserves have been falling steadily. That’s usually seen as a sign that long-term holders are holding tight and not planning to sell. If this continues, it might create a supply crunch, pushing prices even higher.
Bitcoin ETF Inflows Cool Down While Ethereum ETFs Stay Hot
Institutional interest in Bitcoin spot ETFs is still steady, but daily inflow volumes have dropped. On Tuesday, net inflows were around $80 million, which was the lowest seen in four days. That’s a big drop from July 3, when daily inflows reached $602 million.
Bitcoin is still trading above $100,000, staying close to its peak. Yet, retail investors have not jumped in the way they did during past bull runs. Most of the price support right now is coming from institutional players. They continue to back Bitcoin through spot ETFs, which helps maintain price stability.
Ethereum ETFs, however, are showing more strength in the short term. On Tuesday, they saw about $47 million in net inflows. This keeps the bullish trend going. Altogether, Ethereum spot ETFs have now attracted $4.51 billion in total inflows. Their total net assets are up to $11.03 billion.
XRP Moves Past $2.37 as Ripple Names BNY Mellon as Stablecoin Custodian
XRP is seeing a bullish push. It has climbed more than 3% and is trading around $2.37 at the time of writing. This jump came as global market fears rose after Trump said he might expand tariffs. The new round includes items like copper and some pharmaceutical products.
Ripple has made a key move. It announced that Bank of New York Mellon will be the official custodian for its Ripple USD (RLUSD) stablecoin. This was shared in a blog post by the company. It also noted that RLUSD meets regulatory standards, is transparent, and targets use by institutions. The coin is backed 1:1 with the U.S. Dollar. It also holds a New York Trust Company Charter, approved by the New York Department of Financial Services.
Over the past few weeks, Ripple has been growing its stablecoin business. It’s been focusing on regions like Europe and Asia. The goal is to build a system that connects traditional finance with the crypto world. Ripple wants to handle a large chunk of the global money movement currently handled by the SWIFT system.
Market interest in XRP has risen, too. The open interest in XRP futures, meaning the value of active contracts, has gone up by about 30%. Back on June 23, the figure was $3.54 billion. Now, it’s around $4.98 billion. This rise in open interest shows more traders are placing bets on XRP. It also reflects changing risk sentiment and could mean more speculative activity.
From a chart perspective, XRP is showing signs of strength. A Golden Cross has formed on the 8-hour chart. That’s when the 50-period Exponential Moving Average (EMA) moves above the 200-period EMA. It’s considered a bullish signal.
Traders are also watching the MACD indicator. Since Sunday, it has stayed in a “buy” zone. The green histogram bars on the MACD are growing, which suggests that positive momentum is still building. That could point to more gains soon.
A breakout from an inverse Head-and-Shoulders (H&S) pattern is also in play. If this holds, XRP could hit $2.76. That’s about 18% higher than where it is now. This target comes from measuring the pattern’s height and projecting it from the breakout level.
Still, there’s some resistance ahead. The $2.40 level has blocked gains before, most recently on June 20. Traders might take profits here, especially as global uncertainty rises around new tariffs.
On the downside, XRP has a few strong support levels. One is at $2.22, where the 50- and 200-period EMAs meet. Another is the 100-period EMA at $2.21. A broader support area sits at $2.20, which held during a test on July 5. If XRP pulls back, these levels could offer short-term protection.
Dogecoin Showing Signs of a Breakout as Technical Setups Align
Dogecoin might be preparing for a breakout. Several technical signals are pointing in that direction. The coin has bounced off key Fibonacci support levels and a long-term trend line on the weekly chart. This suggests that a new upward move may be starting.
The 200-week moving average has been a solid base for support. Dogecoin has also stayed above a rising channel, which supports the bullish case. On shorter timeframes like the 15-minute chart, the price has dipped back to the 200 MA, which some traders view as a potential entry point. If that holds, Dogecoin might try to retest the $0.16490 level and possibly move higher.
Technical analyst Thomas Anderson shared his breakdown on X. He looked at Dogecoin using the M15 and M30 timeframes. Right now, Dogecoin is trading at $0.17043, but it’s facing resistance at $0.16490, marked by a yellow line on the chart. Anderson noted that price is consolidating near this resistance. That usually means traders are unsure about the next move.
He also mentioned that the red 200 MA on the M15 chart is acting as dynamic support. It’s keeping the price in a range and might help fuel a breakout. On the M30 chart, the price is holding above a rising trendline. That adds strength to the bullish outlook. Anderson suggested that if the price drops back to the 200 MA on the M15 chart, it might be a smart entry point for those expecting a breakout.
Looking at the bigger picture, analyst Andrew shared his insights using Elliott Wave Theory. He says Dogecoin completed a five-wave move higher over the past three years. That was followed by the usual ABC correction, which fits well with classic Elliott patterns.
Andrew pointed out a strong bounce from the 0.786 Fibonacci retracement level, drawn from Dogecoin’s full upward move. That level seems to be a major support point, where buying interest is coming back.
He now believes Dogecoin might be forming a larger 1-2 wave pattern. If that’s true, a big Wave 3 rally could follow. This would likely break past earlier highs and bring renewed interest from traders and investors.
As long as Dogecoin stays above key support areas and technical setups remain strong, the chance of a breakout continues to rise. Traders will be watching closely to see if the current structure leads to a long-term upward trend.


