Bitcoin Holds Above $112,400 Amid Fed Rate

Bitcoin (BTC) started the week higher, trading above $112,400 on Tuesday. The move follows growing bets on Federal Reserve rate cuts and fresh interest from large buyers. Recent additions by Japan’s Metaplanet and the government of El Salvador have also helped sentiment.
| Day | Minimum Price | Average Price | Maximum Price |
|---|
Risk mood improves after weak US jobs data
BTC held above $111,900 in early European trade on Monday, extending last week’s nearly 3% rebound. Friday’s U.S. Nonfarm Payrolls report showed only 22,000 new jobs in August, well below forecasts. Revisions pointed to a loss of 13,000 jobs in June, the first monthly decline since December 2020, signaling a softer labor market.
The unemployment rate rose to 4.3% from 4.2%, as expected. Labor force participation edged up to 62.3%. Wage growth cooled, with annual average hourly earnings easing to 3.7% in August from 3.9% in July. Taken together, the data strengthened expectations for as many as three Fed rate cuts by year-end, a view that has supported risk assets, including Bitcoin.
Institutions add support
Institutional flows also aided the tone. On Monday, Japan’s Metaplanet said it bought 136 BTC, lifting its total to 20,136 BTC. El Salvador marked the fourth anniversary of its Bitcoin law on Sunday with a symbolic purchase of 21 BTC. President Nayib Bukele confirmed the move on social media. The country’s holdings now stand near 6,313 BTC, worth about $706.58 million at current prices.
Spot Bitcoin ETFs drew $246.42 million in net inflows last week, according to SoSoValue. It was the second straight week of positive flows, though still below mid-July levels, when BTC first approached $120,000.
Market Technicals Point to Recovery
After three weeks of declines from its record high of $124,474, Bitcoin posted a 3% gain last week and is still recovering. On Tuesday, the cryptocurrency traded above $112,576, up 0.38% on the day.
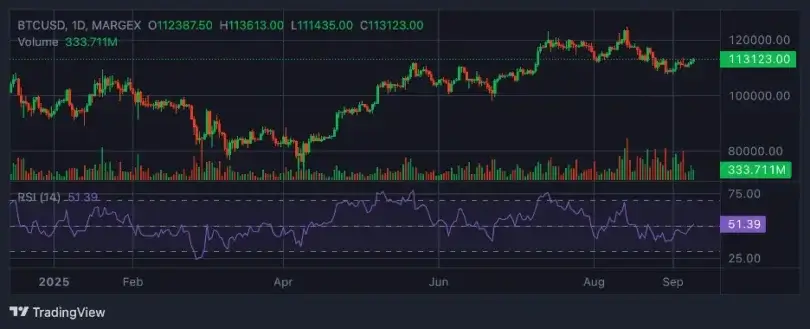
If momentum holds, the next target sits near the $116,000 daily resistance level. Technical signals back this view: the Relative Strength Index (RSI) is at 51, inching toward the neutral 50 line, hinting at fading bearish pressure. The Moving Average Convergence Divergence (MACD) also turned positive on Saturday with a bullish crossover, pointing to stronger momentum.
Still, downside risks remain. A correction could pull prices back toward daily support at $105,573.
Chainlink Gains Momentum as Grayscale Files for Spot ETF
Chainlink (LINK) traded above $23.00 on Monday after reports that Grayscale has filed with the U.S. Securities and Exchange Commission (SEC) to launch a Chainlink spot exchange-traded fund (ETF).
Grayscale Seeks SEC Approval for Chainlink ETF
According to the filing, Grayscale submitted an S-1 form to the SEC for a new ETF that would track Chainlink’s spot price in real time. If approved, it would allow institutional investors to gain regulated exposure to LINK through traditional stock exchanges.
The trust, expected to list on NYSE Arca under the ticker GLNK, would be co-sponsored by Grayscale Investments Sponsors, LLC and Grayscale Operating, LLC, Reuters reported. This marks one of the earliest regulated offerings tied to Chainlink’s decentralized oracle network.
Rising Retail and Derivatives Interest
Retail activity has also picked up. Chainlink futures open interest (OI) reached $1.58 billion on Monday, up from $1.47 billion on Friday. A rising OI often signals that traders expect a price move to continue, reinforcing bullish sentiment.
Technical Setup Points to Further Upside
Technically, LINK remains in a strong position after breaking out of a falling wedge pattern on the 4-hour chart. The token is holding above the 50-period Exponential Moving Average (EMA) at $22.87.
Momentum indicators confirm the strength. The MACD flashed a buy signal on Sunday, while the RSI stands at 57, showing growing momentum.
The wedge breakout suggests a possible 18% rally, with a target near $26.75. A 4-hour close above the 100-day EMA at $23.12 adds to the bullish case. If profit-taking sets in, support lies at the 50-period EMA ($22.87) and the 200-period EMA ($22.43).
Ethereum Holds Near $4,300 as Treasuries Accumulate, ETFs See Outflows
Ethereum (ETH) traded around $4,300 on Monday, showing mixed signals. Corporate treasuries continued to build large ETH reserves, while exchange-traded funds tied to the asset logged their fifth consecutive session of net outflows.
BitMine Expands Ethereum Treasury Beyond $9 Billion
BitMine Immersion (BMNR), a crypto mining and treasury management firm, disclosed Monday that it purchased over 202,500 ETH last week. This raised its total holdings to 2.069 million ETH, worth about $9 billion.
That gives BitMine control of more than 1.7% of ETH’s total circulating supply more than the combined reserves of the next eight treasury firms, including SharpLink Gaming. The company is pursuing what it calls the “alchemy of 5%,” intending to own 5% of ETH’s circulation.
BitMine also invested $20 million in Nasdaq-listed Eightco Holdings (OCTO), one of the largest participants in its $270 million private investment in public equity (PIPE) offering to build a Worldcoin (WLD) treasury. Eightco’s shares surged more than 3,000% after the disclosure.
Growing ETH Treasury Trend
BitMine is now the largest player in a growing trend of corporate ETH treasuries. Strategic ETH Reserve data shows that combined treasury holdings reached 3.8 million ETH last week, valued at roughly $16.3 billion, after fresh purchases by SharpLink Gaming and The Ether Machine.
By contrast, U.S. spot Ethereum ETFs have struggled to attract fresh inflows. Data from SoSoValue showed that the products posted five consecutive days of net outflows, totaling $952.2 million last week. The trend suggests institutional investors may be showing caution or locking in profits after recent gains.
Meanwhile, Ethereum derivatives markets reflected heightened volatility. According to Coinglass data, traders absorbed $48 million in futures liquidations over the past 24 hours, with $22.6 million in long positions and $25.5 million in short positions closed.
Technical Picture: Descending Triangle Signals Caution
ETH has largely consolidated within a $4,100 to $4,500 trading band through the past month, rarely moving outside that range. The pattern has created a descending triangle on the daily chart, defined by a falling trendline since August 22.
A decisive close below support near $4,100, coupled with the 50-day Simple Moving Average (SMA) turning into resistance, would confirm the bearish formation. Such a move could trigger a drop toward $3,472, calculated by projecting the triangle’s height downward from the breakdown point.
On the upside, ETH would need to reclaim the $4,870 level and hold it as support to negate this bearish setup.
The Relative Strength Index (RSI) currently trends sideways near its neutral midpoint, while the Stochastic Oscillator (Stoch) hovers slightly above the oversold region signals that lean toward mild bearish momentum.


