Bitcoin Price Steady, XRP and Solana Face Key September Test

Bitcoin (BTC) opened the week on a steady path, holding above $109,000 on Monday after losing nearly 5% in the prior week. Institutional demand helped soften the drop. Japanese investment company Metaplanet bought 1,009 BTC for its reserves. At the same time, U.S. spot Exchange Traded Funds (ETFs) brought in more than $440 million in inflows last week. Traders remain cautious, but many are still betting that the Federal Reserve will cut rates this month, which could support risk assets like Bitcoin.
| Day | Minimum Price | Average Price | Maximum Price |
|---|
Federal Reserve Bets Shape Market Mood
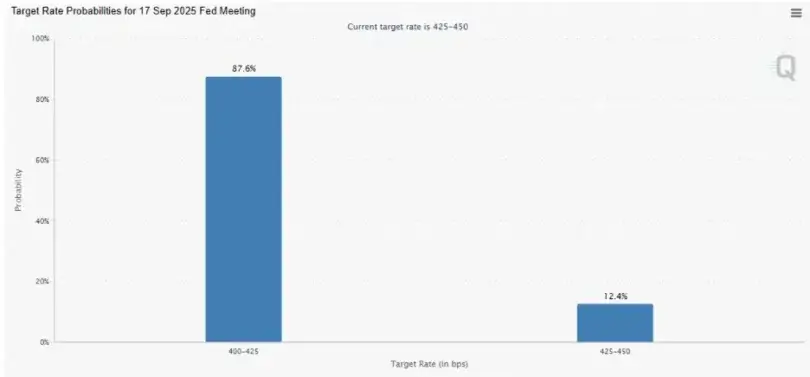
Bitcoin is still down almost 14% from its all-time high of $124,474 on August 14. Over the weekend, the price dropped to $107,350. The main trigger was last week’s U.S. Personal Consumption Expenditures (PCE) Price Index for July, which came in higher than expected. Even so, traders held on to their expectations of a rate cut. According to the CME FedWatch tool, there is an 87.6% chance of a 25-basis-point cut in September, compared to 85% before the PCE report. If confirmed, a cut could pressure the U.S. dollar and improve risk sentiment, creating space for Bitcoin to recover.
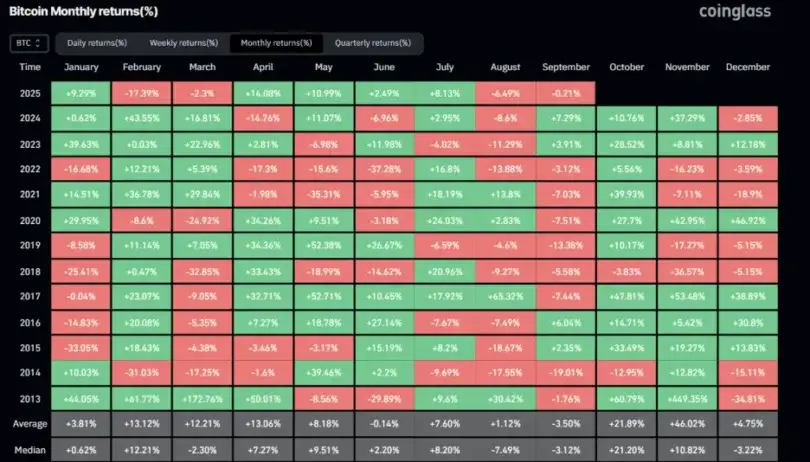
CoinGlass data showed Bitcoin dropped 6.49% in August. Historically, September tends to be weak, with an average decline of about 3.50%. But a confirmed Fed cut, coupled with steady ETF inflows and company purchases, may change that pattern and give Bitcoin the chance to post gains this month.
Institutional Activity Limits Downside
Institutional buying stayed firm despite the correction. Metaplanet confirmed it added 1,009 BTC, pushing its total holdings to 20,000 BTC. ETF demand also held up. Data from SoSoValue showed U.S. Bitcoin spot ETFs had $440.71 million in inflows last week. That compared with $1.17 billion in outflows the week before. Analysts say continued inflows could help fuel Bitcoin’s rebound.
Bitcoin Price Levels to Watch
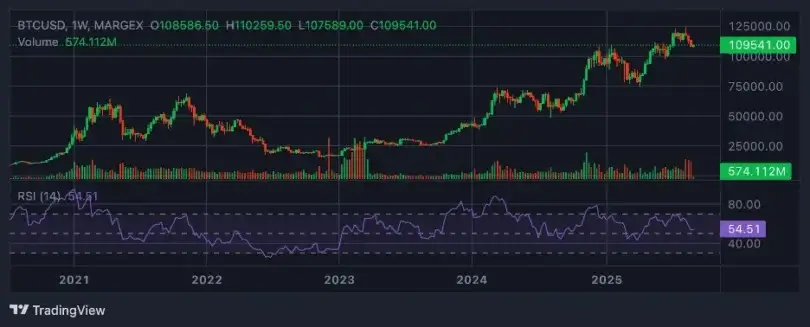
Bitcoin price experienced resistance on August 23 following a blowout of an upward trendline, falling 7.43% over the weekend. The coin was trading at close to $109600 by Monday. The $105,573 support level, which is relatively near the 61.8% Fibonacci retracement of $105,386 calculated between the low of April at $74,508 and the high of August at $124,474, is under observation by analysts. With that in place, the zone could position a move to resist at $116,000.
Technical indicators are ambiguous. The Relative Strength Index (RSI) was at 54 on the daily chart, which is more than the neutral 50 and an indication of further bullishness. It would take RSI to go back above the neutral point to have a lasting recovery. On smaller time frames, though, the 4-hour chart reflected a bullish divergence since BTC was hitting a lower low, and RSI was drawing higher highs, which many consider an initial indicator of a reversal or imminent upswing.
With a strong follow-up, there is a possibility that Bitcoin goes up to the 50-day Exponential Moving Average (EMA) of $110,650 on the 4-hour chart, and potentially higher to the high of the week on Friday, at $117,429. On the other hand, the loss of support could lead to further deterioration, maybe down to weekly support of $104,463.
The technical structure of Ripple XRP was weak on Monday as larger issues loomed over the cryptocurrency market, and September is traditionally considered a bearish month in the digital currency sector.
XRP was trading at a high of over $2.76 at the time of writing, though buyers were trying to find short-term support to avoid further collapse, which may see the price drop to as low as $2.50.
Focus on U.S. macroeconomic indicators
The token’s performance in September is expected to hinge on upcoming macroeconomic data from the United States. Key inflation metrics are likely to get a lot of attention. These include the unemployment rate due Friday, the Producer Price Index (PPI) on September 10, and the Consumer Price Index (CPI) and Jobless Claims set for September 11.
These will provide crucial information for the Federal Reserve ahead of its interest rate decision due September 17.
According to the CME FedWatch tool, there is a nearly 90% probability the Federal Reserve will make a 25 basis point (bps) cut, dropping the funding rate to 4% – 4.25%; the first rate cut of the year. This will likely provide a boost for risk assets, particularly equities and cryptocurrencies.
The projected rate cut from the Federal Reserve (FOMC) could bring the demand for XRP tokens, and on the other hand, if the rates are maintained, a disaster could be waiting for the stock markets them. This is also likely to complicate the memory of September, which is known for bearish trends and low performance.
Seasonal Returns
Both the XRP bulls and bears, while waiting to play their strategies, notice the price trends in September for the past 3 years. According to CryptoQuant, XRP has also won in September for the last 3 years. These trends indicate an increase of 46.2% in September of 2022, a faint increasing value of 0.42% for September 2023, and an increase of 7.98% for 2024.
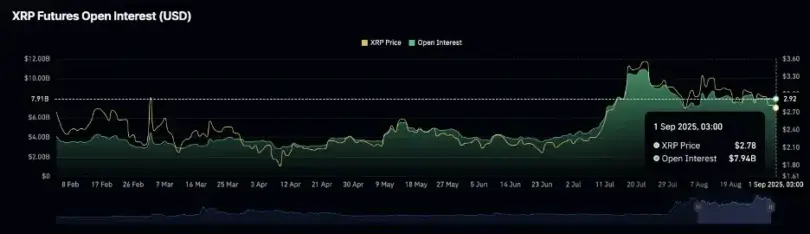
Forecasts for the future indicate a bull run for the cryptocurrency and ecosystem. This will also be bolstered by the sustained retail investment, which is seen in fiat and fiat equivalent open interest for XRP futures contracts amounting to 8 billion. Ethereum holders and XRP circled holders are readily observing the open interest, which is the metric for future contract holders.
Current statistics indicate an XRP price that is below 0.85. This proves a lack of interest and engagement. Those who are willing to bid for XRP are also interested.
XRP, with a moving average for the last 77 days of 2.76, also suggests a lack of interest.
The Moving Average Convergence Divergence (MACD) indicator has been flashing a sell signal since July 25, with the blue MACD line staying below the red signal line, reinforcing bearish pressure.
Momentum indicators further confirm weakening buying activity. The Relative Strength Index (RSI) has slipped to 39, down sharply from its July peak of 88, highlighting fading bullish momentum as traders take a cautious approach.
Still, analysts note that a daily close above the 100-day EMA would improve sentiment and potentially strengthen bullish momentum. Should that occur, XRP could aim for key resistance milestones, including a move back above $3.00 and a breakout beyond the $3.35 level, last tested in mid-August.
BNB Price Analysis
BNB is down nearly 3% over the past seven days, with the token consolidating near the $850 support level on Monday. The exchange’s native token is still trending higher, but it has lost all the gains made during the late August breakout when BNB briefly topped out above $900, as you can see on the BNB/USDT daily chart.
Among others, technical analysts spot potential support zones at $820 (S1) and $785 (S2), which are seen as key levels for the token. Technical indicators are showing mixed signals: the moving average convergence divergence (MACD) index indicates negative momentum in the price movement, and the relative strength index (RSI) is 53.
So, if BNB sweeps liquidity at S1 and a rebound occurs, the bearish outlook may be busted. In that case, the token could try to test resistance near $900 again as part of a larger push to a new all-time high.
Solana Price Analysis
Solana followed BNB’s performance by losing 3% in the last week. The token is currently trading at $200.80, maintaining a strong support just above the $200 mark. Two major levels of resistance have been noted for Solana: $228.24 (R1) and $250 (R2), which were both honored earlier in the trading session.
SOL touched a historical high of $295.83 on January 19, and a continuation in the current bullish move could set the asset up for another test of the high. The MACD supports a bullish case, while the RSI reading of 54 reflects a neutral stance with a slight bullish tilt. Despite this, consolidation near $200 has raised concerns of a possible correction.
Support levels to monitor include the August 20 low of $126 and the August 26 low of $185. A daily close below the $200 threshold would undermine the bullish thesis and potentially pave the way for further downside in Solana’s price action.


