Bitcoin Retreats After Missing All-Time High, BONK Targets 60% Surge, AVAX Approaches $30

Bitcoin (BTC) has been rotating at $103,500 level since yesterday as the coin could not climb above the substantial barrier at the $105,000 level several times. The upcoming round of the Ukraine-Russia talks to be held in Istanbul, from Thursday, may give a boost to the risk-on assets like BTC if tangible agreements are made. While at it, market fundamentals of Bitcoin are still strong whereby funding rates have slightly turned positive, an identical trend observed in the favorable environments witnessed during the aggressive bull periods such as in October 2023-2024.
Ukraine-Russia High-Level Talks Could Boost Risk Assets
According to a report by The Washington Post on Wednesday, Russia and Ukraine are to engage in their first high-level face-to-face discussions since 2022, on Thursday.
The talks were initiated by Russian President Vladimir Putin, partly because of increased Western pressure for a 30-day ceasefire to bring permanent peace. U.S. Secretary of State Marco Rubio and envoys Steve Witkoff and Keith Kellogg will attend the negotiations, and the new diplomatic initiatives will feature. Volodymyr Zelensky, the president of Ukraine, welcomed the proposal warmly, and he has called to advance the discussions on the presidential level, openly inviting Putin for the face-to-face meeting.
While an in-person talk between Zelensky and Putin is a question of time, Thursday’s negotiations can be deciding. If the sense of significant progress toward resolving the Russia-Ukraine war develops, investor confidence can significantly gain in strength, emerging in a risk-on mood in the global markets and supporting the prices of risk-oriented assets such as Bitcoin.
Bitcoin Recovers on U.S.–Saudi Trade Agreement, Softer U.S. CPI
Bitcoin prices stabilized on Tuesday and closed above $104,000. This positive impetus was fuelled by the U.S. securing a huge $600 billion trade deal with Saudi Arabia, which involved cutting tariffs and translating into optimistic sentiments from investors, according to insights from QCP Capital.
In addition, the latest U.S. consumer price index (CPI) was below market expectations, further market expectations for the possibility of rate cuts by the fed. However, the Fed is still prudent on how the tariff effects will be permanent with inflation and level of employment.
Bitcoin Rally Appears Robust
Although the current price of Bitcoin has consolidated recently, K33 Research recommends in its latest report that its upward trend remains healthy, with good indicators that it could continue.
The report shows that, Binance’s BTC/USDT perpetual 7- day average annualized funding rates have shifted from being negative to marginally positive territory. Such a shift is consistent and corresponds to the healthy risk appetite patterns that were previously recorded at the previous bullish cycles, namely in October 2023–2024.
Besides, analysts have noticed a lack of highly speculative euphoria in 2x leveraged long BTC ETFs compared to other market rallies, signaling yet another positive light for Bitcoin in the short term. Additionally, the growing integration of btc bank solutions into crypto ecosystems may further stabilize market dynamics.
The remaining reason justifying the conservative and defensive attitude among traders is shown in the attached graph. The 2x leveraged long BTC ETF, BITX, currently has BTC-equivalent exposure equaling to 51,305 BTC, down from the 76,755 BTC it was at peak level on December 17. Compared to the rallies that were observed in March and November 2024, the inflows into this financial instrument have not been increasing exceptionally yet indicating that the traders are not taking a very aggressive approach.
Bitcoin Price Analysis
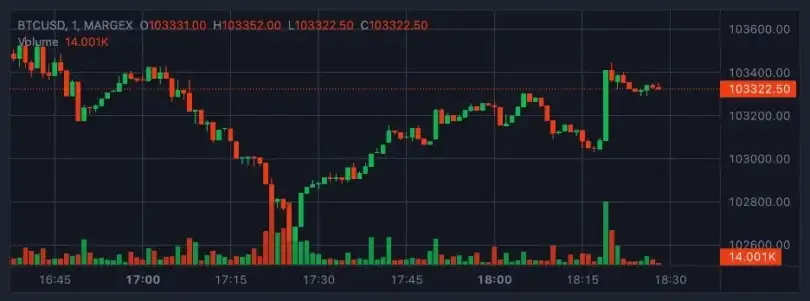
Bitcoin faced resistance at $105,000 level on Sunday, which saw it drop by 2% during Monday. BTC recovered mildly on Tuesday but currently on Wednesday, the cryptocurrency is down a bit and is trading at around $103,600.
If Bitcoin is to continue its current decline, then experts expect a retest of the significant psychological support level at $100,000.
On the daily chart, Bitcoin’s Relative Strength Index (RSI) has declined to 69 that is below the crucial overbought level of 70 and moving in a downward trajectory indicating a weak bull pressure. If the RSI trend towards negative improvement and crosses below the neutral zone of 50, then this will surely be a sell signal, and one that may cause the price to correct sharply.
| Day | Minimum Price | Average Price | Maximum Price |
|---|
On the other hand, in case Bitcoin was able to bounce and confirm the breakout above $105,000, it would open the doors for an ascent towards its all-time high of $109,588, established on January 20.
Bonk Breakout Pauses, Technical Indicators are Bullish.
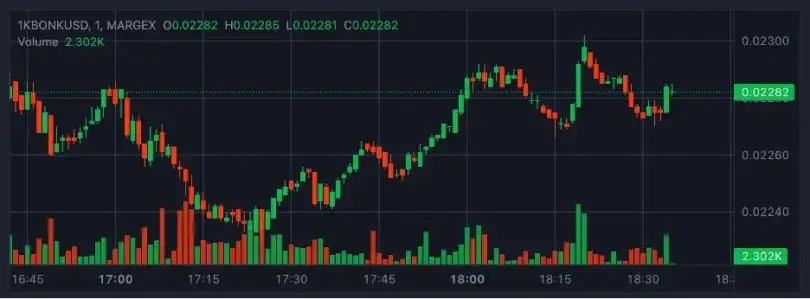
The price of Bonk (BONK) was holding gains around $0.000023 level on Wednesday, after a break-out from a technical cup and handle pattern. This breakout predicts almost a 60% squeeze in the direction of the upside target of $0.000034 that coincides with the overall bullish trend on the cryptocurrency front, prompted by increased risk-on mood.
Bonk’s bounce-back from its April low of $0.000008 in the face of tariff-induced selling pressure took a temporary breather at $0.000021 on April 27. The cost subsequently retested back to the level of $0.000017, and in February-March – the key price area tested as both support and resistance.
| Day | Minimum Price | Average Price | Maximum Price |
|---|
The daily price chart analysis shows the formation of a clear cup and handle pattern that indicates a major 60% bull rally to $0.000034. The correction to $0.000017 attracted a lot of buyers for it supported the bullish movement and verified the technical pattern.
The cup and handle pattern typically signals a bullish reversal after an extended downtrend, characterized by a rounded bottom (the ‘cup’) followed by a brief consolidation phase (the ‘handle’). Such a pattern often indicates robust buying interest and suggests the possibility of a breakout accompanied by increased trading volume.
Bonk managed to overcome neckline resistance now working as support at $0.000021, confirming the breakout from the cup and handle formation, and highlighting the possibility for further increase to $0.000034. This target is calculated by the analysts by taking the height of the pattern from it lowest to highest points and applying it upward from the breakout level.
Investors’ confidence in this bullish stance is as well being backed by the Moving Average Convergence Divergence (MACD) indicator that continues to maintain its position very strongly above its centerline. The MACD line (blue) is hanging strongly over the signal line (red) after giving a buy signal last Friday.
In addition, BONK is trading well above important moving averages with the 200-day Exponential Moving Average (EMA) closing to an area of $0.000020, the 100-day EMA at a point marginally below $0.000018 and the 50-day EMA at
Such positive setup demonstrates good bullish momentum that reaffirms conviction that BONK can realize its estimated cup and handle goal of $0.000034 if buying pressure is sustained.
At the same time, Bonk is bound to register its second positive returns month in a row. By the CryptoRank scale, the cryptocurrency has appreciated by 21.4% already in May following an impressive 73.4% that has been recorded in April.
Risks to Bonk’s Upward Trajectory
Despite the promising technical outlook, traders should remain cautious, particularly regarding the Relative Strength Index (RSI), which is nearing overbought levels. An RSI reading exceeding 70 traditionally indicates overbought conditions, signaling strong bullish momentum but also increasing the likelihood of a potential price pullback.
If traders decide to adjust their positions or secure profits, a reversal in the trend may follow due to intensified selling pressure. Therefore, key support levels to monitor closely include the 200-day EMA near $0.000020, the 100-day EMA just under $0.000018, and the 50-day EMA at approximately $0.000017.
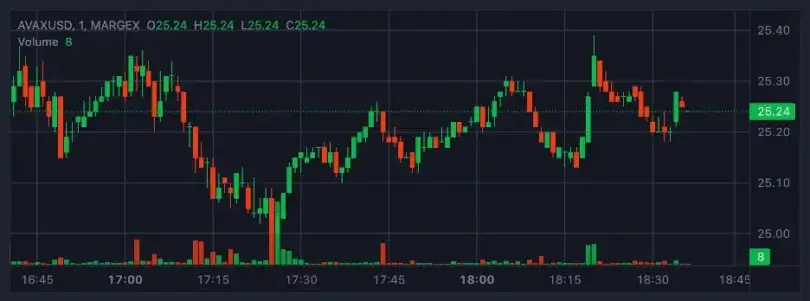
Avalanche (AVAX) is exhibiting signs of renewed bullish momentum as it moves toward a critical resistance point near $26.07, according to data available at the time of writing on Wednesday. Supported by encouraging on-chain metrics and a positive technical outlook, the cryptocurrency appears well-positioned for further gains. With buying interest strengthening and momentum shifting positively in favor of bulls, AVAX may soon reach the $30 milestone.
Avalanche bulls gain control over market momentum
Data from CryptoQuant, presented in the chart below, demonstrates increasing buying pressure for AVAX. Specifically, AVAX’s Taker CVD (Cumulative Volume Delta) has remained positive and steadily risen since early May. This metric tracks the cumulative difference between market buy and sell volumes over the past three months. When the 90-day CVD remains positive and rises, it indicates a dominant buying phase, whereas negative and declining values suggest a seller-dominated market.
| Day | Minimum Price | Average Price | Maximum Price |
|---|
Further bolstering this bullish narrative, data from CoinGlass indicates that futures Open Interest (OI) for AVAX on exchanges climbed significantly, rising from $488.25 million last Friday to $622.54 million by Wednesday, marking levels not witnessed since early February. Rising OI generally implies fresh or additional capital entering the market, which could further support the ongoing rally in AVAX prices.
Avalanche Price Analysis
As from Sunday, Avalanche has been under pressure when it comes to its price action relative to its 200-day Exponential Moving Average (EMA) at $26.07. But as early as this week, AVAX successfully retested and recorded solid support at its 100-day EMA level of $23.21. As of Wednesday, the crypto has found itself close to the important level of resistance of $26.07 once more.
Provided that the AVAX can break above and close above the important 200-day EMA level at $26.07 on the daily chart, it could continue growing to retest the psycho-level $30.
On the technical side, these bullish expectations are confirmed by certain indicators, with Relative Strength Index (RSI) at 69 on the daily chart and rising toward the overbought territory above 70. Although it indicates a powerful bullish momentum, traders should stay careful since the scope for a short-term pullback increases as soon as the market goes into oversold territory. Alternatively, the RSI could continue to stay above the 70-level keeping on rising while strengthening bullish intentions.
If a corrective move happens, AVAX may retest and even test its support at the 100-day EMA at $23.21.