Bitcoin Retreats from Record High as Miner Selling Pressure Mounts While Solana’s $250 Breakout in Sight

Wednesday was a changing day for Bitcoin (BTC), as it fell below the $87,600 mark after reaching a new high of $92,007 on Monday.
It’s the second day in a row of losses for CANN following a substantial 35% rally since November 5. Now, analysts are also talking about technical signals that indicate the recent upward momentum is just past its limits and could happen to correct a little.

Tuesday also marked a high for Bitcoin’s miner position index (MPI), a critical metric gauging miners’ Bitcoin outflows that spiked to its highest level of the year. A signal that miners are boosting their sales, which are usually crypto speak for profit, is also been shown by this elevated reading of $ Bitcoin’s (BTC) elevated MPI reading.
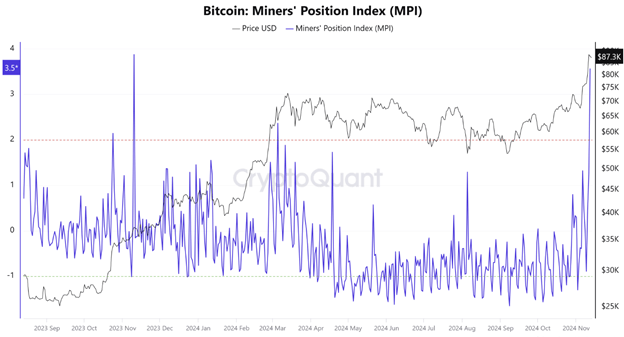
Bitcoin is moving out of miners’ wallets compared to its annual average, according to the MPI. If readings are incredibly high, it indicates a lot more bitcoin is being withdrawn than usual, and previous readings at extreme highs have been related to price crashes.
Tuesday’s MPI of 3.56 was close to a peak of 3.87 last year, which dropped prices 6% in the following four days. Bitcoin can expect a similar one down the road if history is anything to go by.
Institutional Demand for Bitcoin ETFs Rises
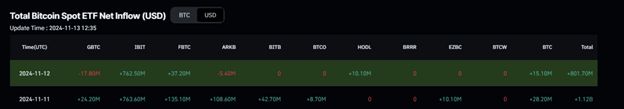
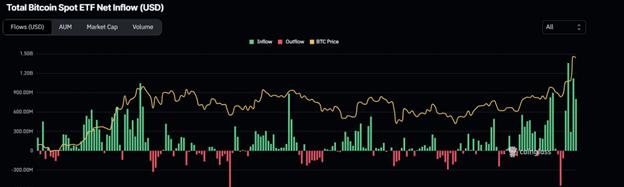
Institutions continue to show interest in Bitcoin spot ETFs, as introduced in January, despite recent sell-offs by Bitcoin miners. Bitcoin’s price dipped Tuesday, but U.S. spot Bitcoin ETFs attracted inflows of $801.70 million, led by BlackRock’s IBIT fund, which added $762.50 million of its own, data from Coinglass showed.
Strong inflows to BTC ETFs could protect Bitcoin’s price, given the recent inflows of institutional wits viewing BTC as a ‘digital gold’ alternative. QCP Capital recently published a report on this shift, highlighting that Bitcoin has rallied 30% post-election while gold has lost 5%, potentially reallocating capital from traditional safe havens to Bitcoin.
Bitcoin Price Hits Record High, Faces Potential Correction
A seven-day rally pushed Bitcoin to an all-time high of $89,940 on Tuesday. Yet the momentum seems to be petering out, and the cryptocurrency is down slightly to $87,600 on Wednesday.
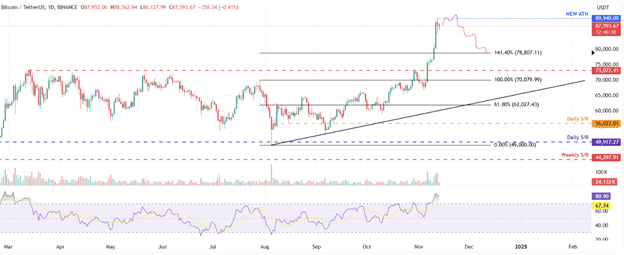
The relative Strength Index (RSI) is at 80 on the daily chart, which is way past the overbought threshold of 70. This indication is a bullish exhaustion signal and can signal a market correction.
If the RSI moves out of the overbought zone, the pullback might be triggered by a way out of the overbought zone by traders.
If the trend continues lower, initial support for Bitcoin’s price may come in at $78,807, the 141.40% Fibonacci extension level from the July high of $70,079 to the August low of $49,000.
Bitcoin Tests $90,000 After Reaching New All-Time High
On November 13, Bitcoin was testing the upper limits of its range after a short spike above $90,000, an all-time high.
According to Keith Alan, co-founder of trading resource Material Indicators, Bitcoin must slow down and create structural support in its new price range.
BTC needs to slow down the pace and build some structural support in the new range. $80M in BTC ask liquidity stacked at $90k, and a $177M sell wall at $100k “should” pump the brakes. pic.twitter.com/zHl7mJtKuh
— Keith Alan (@KAProductions) November 12, 2024
According to CoinGlass data, the price, which hovered around 2% below, maintained its strength in liquidity around the $90,000 level.
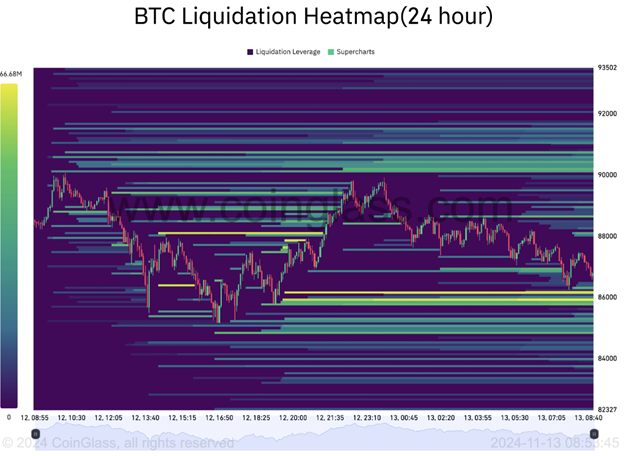
According to Material Indicators, which spoke to one of its proprietary trading tools, the current conditions may continue in the short term.
Trend Precognition is flashing a new ⬇️ signal on the $BTC Daily chart. It’s signaling that price isn’t likely to make a new ATH over the next 24 hrs, however, proceed with caution as periods of euphoria could push price back up and invalidate this signal before it prints at the… pic.twitter.com/ILyChLmy2e
— Material Indicators (@MI_Algos) November 13, 2024
As such, others with a more cautious outlook expect further range-bound behaviour before more positive movement. Trader Credible Crypto echoed this idea, having previously warned that Bitcoin could go as low as $50,000 or even less.
While I still don’t believe this is the impulsive move that most believe it is- $BTC has gone quite a bit higher than expected which changes things a bit on my end from a trading perspective.
Really only two ways about this atm:
1. This is a massive bull trap
2. We keep…— CrediBULL Crypto (@CredibleCrypto) November 12, 2024
While hopes for more gains remain more optimistic than reality, many are calling for a cooling-off period. Unfortunately, the more bullish Bitcoin price predictions still see a key target of $100,000.
Bitcoin performance closely follows liquidity trends and Fibonacci extension levels, explained Willy Woo, founder of Bitcoin data platform Woobull, in a post on X. Bitcoin’s next move, said Woo, is in the critical price zone over $100,000.
Solana Price Pullback Ends Seven-Day Winning Streak
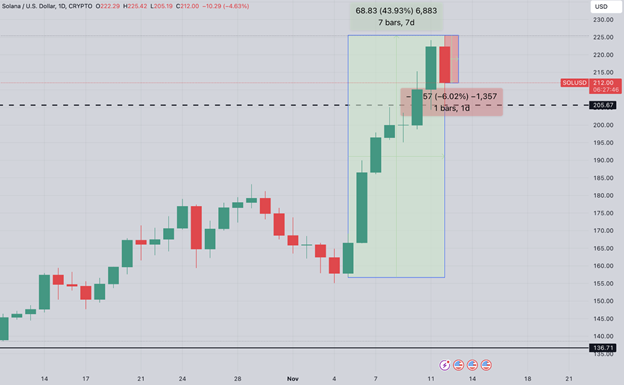
Tuesday saw Solana (SOL) fall from $225 to $205, hitting a 7% price retracement. This put a halt to a seven-day rally that saw the cryptocurrency rally become the third largest by market capitalisation.
Even as it treads back down, on-chain data indicates SOL can hold above the critical $200 mark once Binance lists two new and recently minted memecoins of the Solana network.
Selling momentum from Donald Trump’s poll victory has buoyed the broader cryptocurrency market, which has been on an upward trajectory since November 5.
During the seven-day rally, Solana achieved two significant milestones: As the third largest cryptocurrency, SOL surged past the $100 billion mark in its market cap for the first time in three years and surpassed that of Ripple (XRP), propelling the network’s valuation past $1 billion in market capitalization.
But the rally hit a speed bump on Tuesday as Bitcoin traders began to take profits, causing a wave of liquidations across the altcoin market that wiped out Solana’s upward momentum.
For example, the SOLUSD daily chart indicates the Solana (SOL) price soaring from $156 on November 5 to $225 by the early hours of November 12, a three-year high, with a 43.9% price surge. Nevertheless, Solana’s price has retraced by 6% following a market-wide pullback and is currently trading around $212 at the time of publication.
Despite the worry that Solana may be heading into a lengthy correction due to its overbought condition, on-chain data trends support continued demand for the native memecoins backing the blockchain, which could help absorb sell pressure over the subsequent few sessions.
Other prominent altcoins, like Cardano (ADA) and Shiba Inu (SHIB), experienced double-digit corrections on Tuesday, but Solana’s bulls received some early cheers from Binance’s announcement.
On Monday, the exchange revealed the listing of two new Solana-based memecoins: The American Company To The Prophecy of AI (ACT) and Peanut Squirrels (PNUT).
After listing, ACT and PNUT saw their market caps grow by over 400% in the 24 hours following their listing. Both ACT and PNUT remain highly sought after, so their market caps are now at $550 million and $450 million, respectively.
While market-wide correction leaves plenty of losers, traders, and investors eagerly jumping on board to buy these meme tokens, the need to pay transaction fees in SOL coins will drive both demand and push back on the effects of the correction.
Granted, Solana’s price rise has been the result of the surge in meme coin trading, which has also banded together both speculative traders and long-term investors. This trend was further confirmed by real-time data from Hellomoon—a Solana blockchain analytics platform—which shows that steadily more buyers remain active than the number of sellers on the network, even as the market retraces Tuesday.
The data confirms that as of November 12, 4.13 million Unique Receivers were listed—this is a proxy for the day-to-day number of addresses purchasing SOL. However, while there were 3.37 million Unique SOL Senders, the total number of Unique solend sellers (i.e. active sellers) was tracked at 9.25 million.
Normally, when we observe such a shift, such as when a market declines, active buyers surpass sellers as an indication that accumulating buyers are taking a stance on price improvement on the horizon.
In the case of Solana’s memecoins, ACT and PNUT, which racked up a combined $1 billion market cap in their first 24 hours on Binance, those newly listed memecoins were likely the reason the $200 level held up so well on Tuesday. This momentum only belies the resiliency of Solana’s market despite the more comprehensive market corrections.
Solana Price Analysis
Solana’s price, after a short dip below $205, soon recovered, adding $210 and dropping its daily loss to just 5%. Bulls can, therefore, take advantage of the increase in buying pressure, especially after Binance listed ACT and PNUT for trading, to make a sudden upward move.
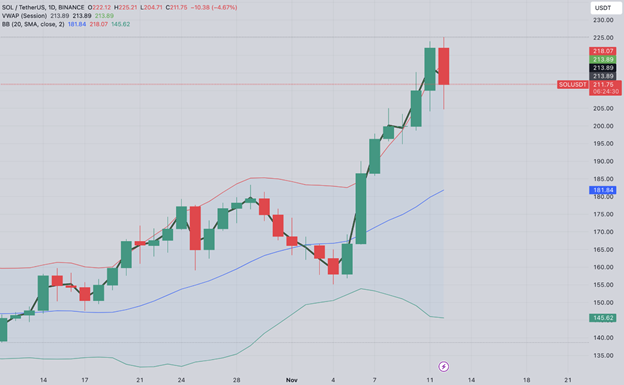
Since Tuesday’s correction erased weaker hands, technical indicators on the SOLUSD daily chart indicate an upward rally potential for Solana to $250. The appearance of widening Bollinger bands suggests higher volatility and more robust trading volume, indicating that prominent market activity is in progress.
But considering Solana’s current price is about $212 and is trading just under the Volume-Weighted Average Price (VWAP) of $213.89, we can not rule out the possibility of a continuation of bullish momentum. If SOL can close above its crucial resistance level at $250, it must break out before continuing its breakout towards $250.
On the negative side, the very $205 support level will continue to be something to watch. This support is needed to hold; if not, the bullish outlook will be invalidated, and it may cause a protracted correction towards the 20-day moving average ($182).


