Crypto Market Update: Bitcoin Recovers, Ethereum Holds Steady

Bitcoin (BTC) is showing some recovery. As of Monday, it’s trading above $115,000. This follows a nearly 5% drop last week. But wider market conditions are still uncertain. A recent update from SEC Chair Paul Atkins didn’t help much. His comments didn’t push prices up. This shows that regulations alone may not be enough to lift the market in the short term.
Data from SoSoValue reveals early weakness in U.S. spot Bitcoin ETFs. Last week, these funds saw $643 million in outflows. That’s a sharp reversal from seven straight weeks of inflows, which started in mid-June. It’s also the biggest weekly outflow since mid-April. If this pattern continues, it could push Bitcoin lower in the coming days.
Some institutional interest is still present. A Japanese company, Metaplant, added 463 BTC to its portfolio. This brings its total holdings to 17,595 BTC. Moves like this could offer some price support if things worsen.
The recent dip in Bitcoin followed the Fed’s interest rate decision. The U.S. central bank kept rates steady at 4.25%–4.50%. But they gave no hint about cutting rates in September. This firm stance caused broader risk assets, including Bitcoin, to take a hit.
Adding more pressure, U.S. President Donald Trump announced new tariffs on several countries last week. This raised investor fears. As a result, U.S. equities dropped. Crypto followed.
Despite all this, NYDIG reported a more optimistic angle. The White House issued a report in favor of digital assets. Meanwhile, SEC Chair Atkins also mentioned upcoming regulatory changes. These are meant to support long-term industry growth.
Bitcoin Testing Support, Indicators Suggest Possibility of Bounce
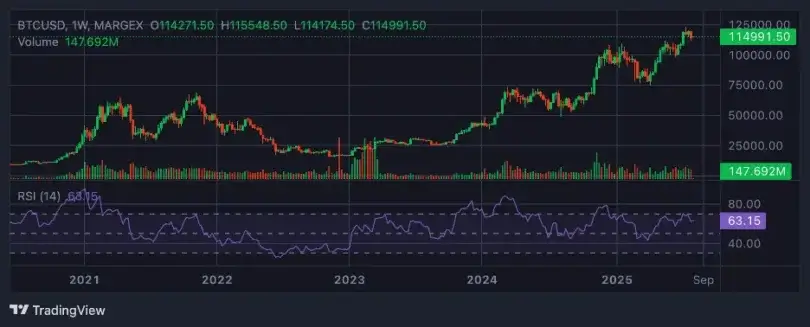
Bitcoin ended last week with nearly a 5% fall. It couldn’t hold above $120,000. This drop pushed BTC back to retest a key level near $111,980, its old all-time high. But by Monday, it showed early signs of stability. It was trading just over $115,000.
Weekly chart signals suggest a recovery is possible. If BTC holds near the $111,980 support level, it might climb back toward $120,000.
Technical tools back this up. The RSI on the weekly chart stands at 63. That’s above the neutral 50 mark. It suggests buyers are still active. The MACD is also showing a bullish crossover. This points to a broader uptrend staying in place.
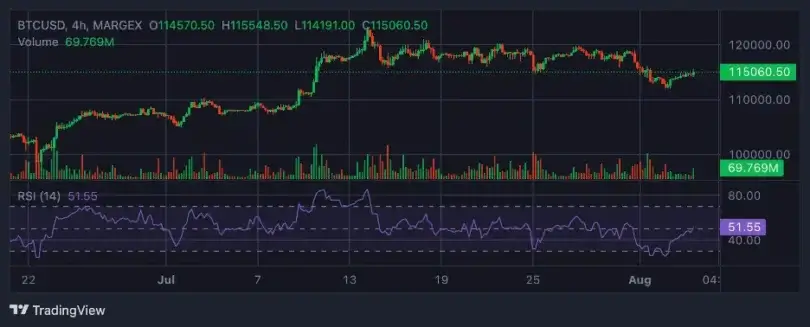
Looking at the daily chart, Bitcoin slipped below its $116,000 support last Thursday. Over the next two days, it lost about 3%. The price landed near its 50-day EMA, which is around $112,974. This area overlaps with the $111,980 level and forms a key support zone.
On Sunday, BTC bounced 1.48% from this level. If this bounce holds, it might make another attempt to regain the $116,000 mark. That area was once a strong base during the recent consolidation.
The RSI on the daily chart is 51. It was slowly moving above 50. A break above 50 would be a good sign for strength in the recovery. If the price dips again, the 50-day EMA at $112,975 may be tested. A break below that could mean more losses ahead.
| Month | Minimum Price | Average Price | Maximum Price |
|---|
Ethereum Stable Near $3,500 After a Sharp Drop
Ethereum (ETH) is trading close to $3650. This comes after it dropped nearly 10% last week. The broader market weakness came from new U.S. tariffs and the Fed’s firm rate policy. Both hit riskier assets hard.
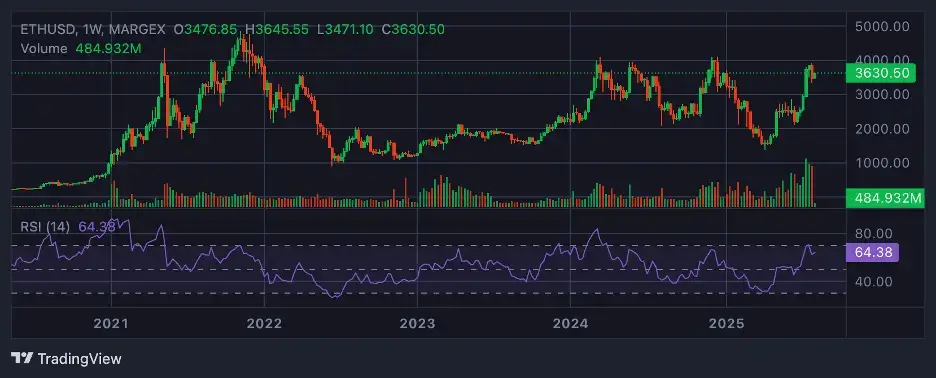
Despite this, demand from big investors remains strong. U.S. spot Ethereum ETFs had $154 million in net inflows last week. That’s the 12th week in a row with positive inflows. Though this is much lower than the prior week’s $1.85 billion, it still shows that investors are buying.ETH found support near its 78.6% Fibonacci retracement level, around $3,392. That’s based on its price movement from April to July ($1,374 to $3,946). It has since bounced slightly and is now back above $3,500.
Before this recent decline, ETH had risen past $3,600. Big firms like Bit Digital were increasing their Ether holdings. Their reserves went over 120,000 ETH. Also, U.S. ETFs saw inflows nearing $1.78 billion over four days. Bitwise’s Matt Hougan expects ETH ETFs to bring in up to $10 billion more in the second half of 2025. The growing focus on stablecoins and tokenization is behind that forecast.
The technical picture is mixed. RSI is in upward momentum, showing upward momentum which stands at 64.38. MACD shows a bearish crossover. This means momentum is slowing. But if ETF inflows stay strong, they could help prevent further drops.
Solana is Under Pressure
Solana (SOL) remains weak. It failed to break above the $185–$190 level. It’s now stuck in a sideways range between $125 and $180. This range has been in place since early 2024.
Technical signs aren’t strong. ADX is around 15.5. That’s low and shows weak trend strength. SOL recently failed to break higher around $190. Analysts warn that it could fall back toward the lower part of the range. Possible support zones are around $145 and $171.73.
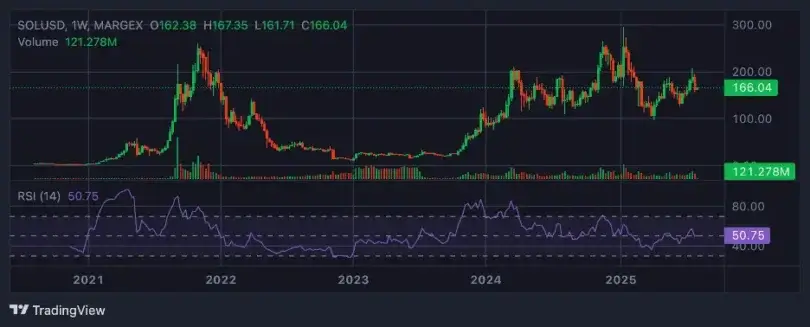
Some chart watchers are pointing to a descending triangle. This pattern could push the price lower, possibly down to $102 if selling continues.
Right now, SOL is trading around $162–$165. This shows that the mood is still neutral to bearish. To change that, SOL would need to build up some strong upward momentum.
Key Demand Area for Solana
An X post from Autumn_Rileyy points to an important area on the chart. SOL has dropped over 25% from its high near $206. It’s now sitting in a demand zone between $136 and $148. This area has seen “smart money” activity in the past.
The chart shows a clear structure break. Price fell through key support, confirming a bearish setup. Still, the demand zone lines up with where buyers stepped in before. If volume rises and price holds steady here, SOL could rally. Targets might be $200, $220, or even $263. But any recovery will likely take time.
Where the Market Stands Now?
Looking at Bitcoin, Ethereum, and Solana together, the market seems cautious:
- Bitcoin is trying to recover, but ETF outflows and macro risks are a concern.
- Ethereum is holding its ground with steady ETF inflows, even after a big drop.
- Solana is still stuck, lacking strong momentum, and sitting in a tight range.
ETF flows are playing a big role in BTC and ETH prices. They help stabilize the market when retail traders are uncertain. ETH inflows remain strong. BTC, however, just saw heavy outflows.
Even with support from large investors, global factors still weigh heavily. New tariffs, Fed policy, and slowing growth are making investors nervous. That’s why we’ve seen steep selloffs in BTC and ETH this past week.
Solana’s technical breakdown shows that altcoins are moving differently. If SOL drops further, it could add to bearish pressure across the sector.
What to Watch Next?
Some levels and indicators will matter a lot in the days ahead:
- Bitcoin: A close above $120,000 could confirm bullish strength. But if it falls below $116,000 again, it might slide toward the $112,000–$112,500 support zone.
- Ethereum: Staying above $3,392 is key. If ETH climbs back over $3,600, it may continue upward. If not, it could fall toward $3,300 or $3,200 if inflows slow.
- Solana: If it keeps trading around $162, the bearish range may continue. A fall below $145 could lead to deeper losses. But if it finds strength in the $136–$148 demand zone, buyers might return.
Events like Fed statements, tariff updates, and ongoing risk trends will steer market direction.


