Bitcoin, Ethereum, and XRP Hold Firm Amid Geopolitical Turmoil and Market Uncertainty

BTC, ETH, and XRP are holding their ground, despite increased geopolitical risks and monetary obstacles. The strength of these three cryptocurrencies can come down to the relatively stable state of the market in such a confusing week, caused by mounting conflict in the Middle East.
Bitcoin Stabilizes Above $102,664 Amid Conflict
On Friday, Bitcoin amassed funds at 102,664 as the war between Iran and Israel heated up. The top cryptocurrency has been going through a consolidation since then, though, staying above this crucial level. BTC is trading at just below 103,000 this week, and its indicators are presenting a mixed picture.
The On-Balance Volume (OBV) on the daily chart is in the form of divergence, which shows a possible trend reversal. In the meantime, the Relative Strength Index (RSI) indicates indecision as it is at the level of 48, approaching the neutral of 50. The Moving Average Convergence Divergence (MACD) is bearish as it is presented by the red bars of a histogram below the neutral line.
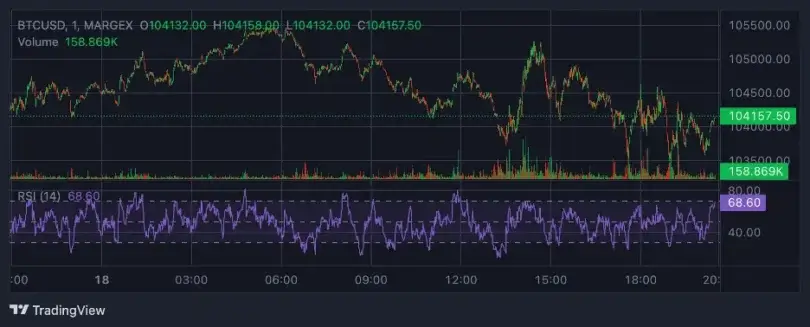
In case of pressure to the downside, the price of Bitcoin may drop to the price of Friday below 102,664. Nevertheless, to the extent that bullishness comes with a breakout to the present range, BTC can re-touch the all-time high of $111,980. It needs to take a challenge to do that by breaking the resistance levels represented by the Fair Value Gap (FVG) on the BTC/USDT daily chart at 106,179 and 108,046.
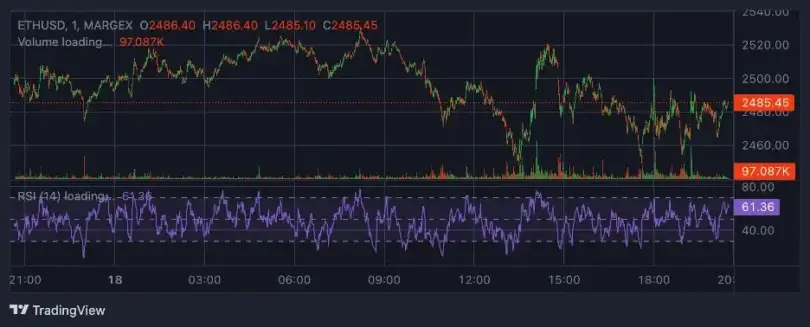
Ethereum Eyes Recovery Despite Waning Momentum
Ethereum is still close to a potential support area without much bullish power, as MACD histogram bars on a three-day chart have turned green and are falling, which may mean that the bullish activity is dwindling. A further chance of a daily candlestick close above the dollar 2,700 is still there, and this may lead to a test of the psychological resistance of dollar 3,000.
Nevertheless, the June 9 high of 2879 may pose an impediment to further rally as interim resistance. On a three-day chart, RSI stands at 55, which means a slight bull feeling.
In a bearish scenario, ETH could sweep liquidity at the $2,400 support level, which lies just below its current trading price.
Ethereum Price Action Echoes 2017 Bull Market Breakout, Analysts See Major Rally Potential
The current market dynamics of Ethereum are being compared heavily to the 2017 bull run, with some of the most popular analysts referring to the technical similarities. Merlijn the Trader was one of the followed crypto market analysts, so it is worth your attention when he released the comparative analysis of X (which is Twitter) with side-by-side weekly charts of Ethereum 2025 and 2017.
The analyst believes that Ethereum is set to repeat the technical breakout pattern that was followed in the past by a significant market rally, and this time the gains may be even more epic.
Ethereum Reclaims Key Technical Indicator, Sparking Breakout Speculation
As illustrated in the Ethereum chart in 2025, the large-cap coin has taken back its 50-week bitcoin move (MA) after several months of bearish trading and sideways movement. We have now seen the breakout above the support levels at around 2,250 collapse to a tight consolidation range immediately below the 50-week MA, which is a story all too familiar with Ethereum in late 2016 and early 2017.
Merlijn the Trader notes that in the 2017 case, Ethereum also went above 50 MA and then went into a short sideways movement before initiating a parabolic rally, causing the start of its historic bull run. These charts, side-by-side, provided by the analyst, focus attention on the structural similarity, indicating that Ethereum can enter a breakout formation this time following a long accumulation pattern.
Structural Similarities with 2017, but a Different Market Landscape
The technical constitution of 2025 seems to do almost the same as the playbook of 2017; the circumstances in the market have, however, changed remarkably. Merlijn points out that the present crypto landscape is marked by further institutional involvement, more established retail investors, and the solid infrastructure developments in the Ethereum space.
The changes were capable of turning up the technical breakout effect, wherein a sharper rise could be experienced than ever before.
The timing of Ethereum’s reclaim of the 50 MA and the subsequent consolidation phase are key markers in the analyst’s thesis. Should Ethereum break above the current resistance level, the chart pattern suggests the possibility of a broader macro rally. According to Merlijn, this could not only echo the explosive move of 2017 but also surpass it in scale.
Potential Price Targets Above $4,000 as Technical Setup Aligns
According to the chart analysis by Merlijn the Trader, there is a possibility that Ethereum will rise to have a price exceeding the value of 4,000. Comparing it to the situation in 2017, when Ethereum shot up to well above the $28 mark when it recaptured the 50 MA and practically the entire market, after trading in the region of $6-$7.50, the analyst states that the same outcome may be currently in store.
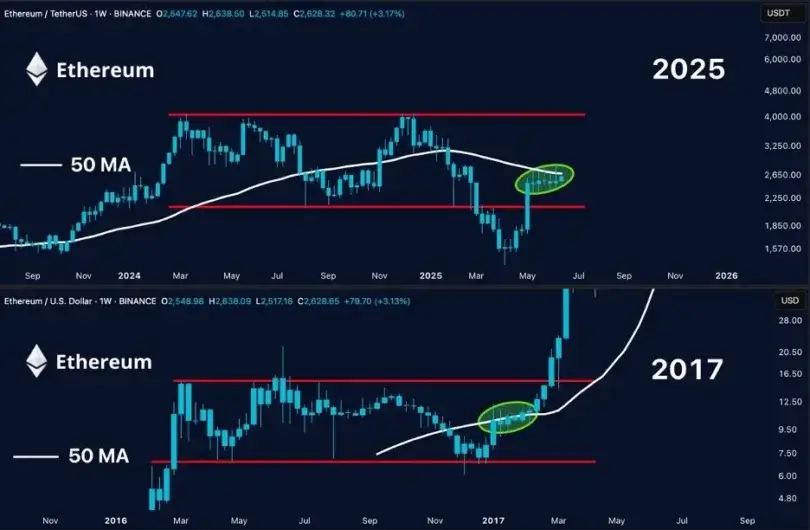
As Ethereum is trading at $2,541 right now, the next step, but a possible scenario under the usual procedure in history, may imply the rise of the asset beyond the barrier of 4,000, which will correlate with the upper red resistance level in the 2025 chart.
In case Ethereum manages to soar above this area, the analyst reckons that the price would find itself in uncharted territory, and it would be able to achieve new all-time highs. Technical and basic conditions will suggest the possibility of the future breakout of Ethereum being not only comparable to its previous one but also being even mightier.
XRP Remains Supportive as Investors Watch for Breakout
The XRP is trading above an important weekly support area of 2.0591, and it is still in the consolidation phase. The altcoin is experiencing resistance at 2.4385 (R1) and 2.6549 (R2), and these may be the target levels in case there is a momentum.
Technical indicators on a weekly basis are unclear. The RSI is at neutral value 50, and the MACD is showing red histogram bars, further falling below the zero line, which makes a case of the perception of investor reluctance. Provided that XRP exceeds resistance at the $2.2648 mark, the coin is likely to go into a bullish streak towards the following resistance levels. On the other hand, any break below the 2.0591 level will possibly result in a liquidity sweep at 2.00, which is a psychologically positive level.
Market Sentiment Holds Steady Amid Israel-Iran Conflict
Even though the Bitcoin market seems calm, there is a point that should be noted. Overall market sentiment among crypto traders is also quite neutral despite all the tensions between Israel and Iran in the last six days. Bitcoin has remained trading above the 100,000 mark, and this confidence has been on the Fear & Greed Index, which is at 52 on the 0-100 scale.
This neutral-to-greedy sentiment range has persisted through recent geopolitical developments, with no major sell-off observed across major cryptocurrencies. The sustained inflows into Bitcoin ETFs and consistent price trends suggest a maturing market dynamic, marking a contrast to the volatility seen in previous global crises.
As long as BTC, ETH, and XRP continue to hold their respective support zones, traders may interpret the current price action as a potential setup for a broader market recovery, pending confirmation from key resistance breakouts.
Top Meme Coins Slide Further as Market Cap Shrinks Amid Middle East Tensions
Meme-based cryptocurrencies have continued their plunge on Wednesday, and the overall market capitalization of the industry has shrank to a new 20% loss during the last month to now $54.41 billion. Leading tokens Dogecoin (DOGE) and Shiba Inu (SHIB) lost about 3 percent each this week, with meme token PEPE falling over 8 percent, as fear over the possible incursion of geopolitical tensions and violence in the Middle East intensifies.
Dogecoin Faces Risk of Falling Below $0.15
Dogecoin also fell by more than 1 percent on Wednesday, now in its eighth consecutive day of losses and consequent to losses of some 15 percent in this time frame. The meme coin dropped by nearly 2 percent on Tuesday, reaching a six-week low of $ 0.1639.
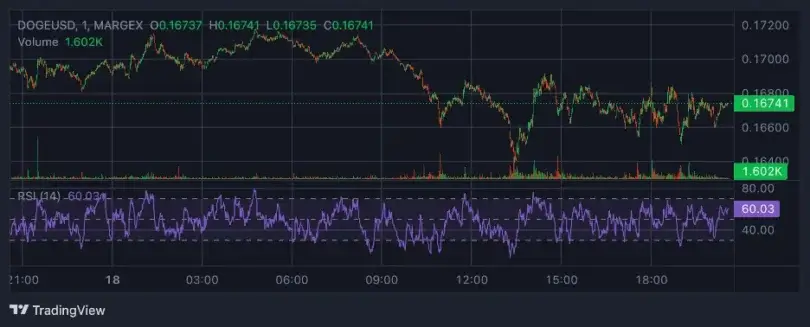
The bearish direction draws attention to an important support point at $0.1642, the low of May 6. In case Dogecoin is unable to break the previous day’s close above this level consistently, then the next important line to observe is the $0.1428 observed on April 8.
There is an increasing bearish pressure revealed by the technical indicators. The MACD (Moving Average Convergence/Divergence) is also declining into an increasingly bad side with the signalling line following behind, adding more weight to the power of decline.
The Relative Strength Index (RSI) is at 35 and is drifting towards the oversold area and indicating that there is an even greater negative build-up.
Nevertheless, even though the weakness is still at hand, should DOGE somehow manage to occupy the ground above the $0.1642 mark, a short-term reversal of this trend may push the price back to its monthly peak of $0.2067.
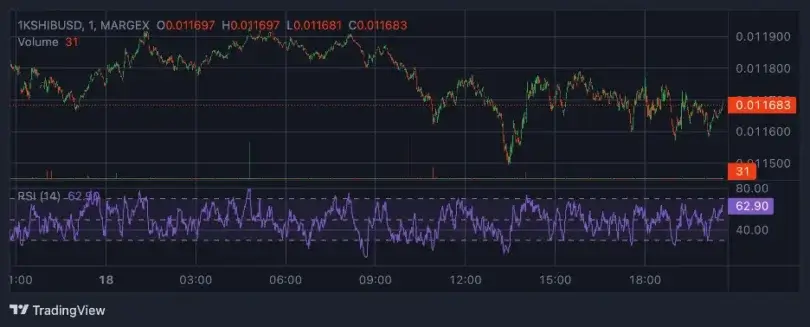
Shiba Inu Mirrors Dogecoin’s Bearish Pattern
Shiba Inu follows the example of Dogecoin closely as it also shows its eighth day of loss in a row. SHIB has retained the value of the support point of 0.000010, which represented the bottom close value in the month of March. The asset has been on a two-month low of $0.00001134 on Tuesday, which added to its downward trend.
Although Shiba Inu did not fall beneath a crucial support line of $0.00001150 so far, the possibility of a comeback seems to be more unlikely. Closes below this value each day could lead to the next bullish move towards the $0.00001029, the lowest value posted this year.
It has been observed that bearish signs are imminent throughout important indicators. The RSI is indicating an oversold state of 36 per day, and the MACD is negative, and the MACD signal line is pointing down, a signal heard in the Dogecoin indicators as well.
Memo coins are continuing to stay weak, and there is no immediate bullish trend, as far as market sentiment is concerned, as the market in general is risk-averse.
Shiba Inu Eyes While PEPE Near Critical Area Support
Although Shiba Inu (SHIB) also maintains its downward Bullish trend in recording Dogecoin (DOGE) prices, a breakout as a relief might be in sight. The rebound may also trigger SHIB to return to the price of 0.00001200, which is equivalent to the June 5 close price. This is, however, not to be unless there is a change in the momentum, which is all negative on the major technical indicators.
PEPE Recovering to retain support on $0.00001000
Another well-known meme coin, PEPE, is struggling to maintain the psychological support of 0.00001000, but its weekly losses have stretched to almost 10 percent. Recent performance has highlighted the bearish sentiment in the token, favoring price action at the downside.
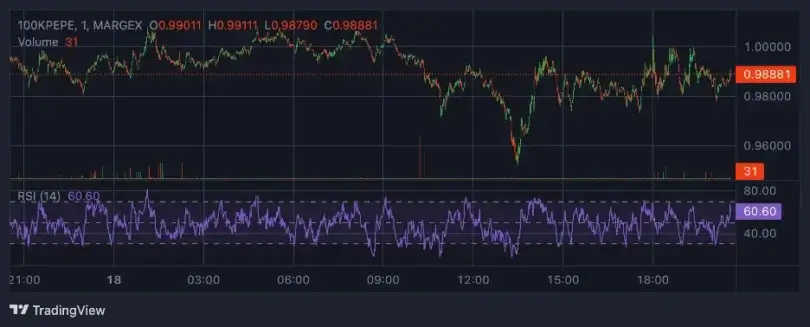
In case of the daily candle closing beneath the important level of $0.00001000, PEPE could be exploring the support area of $0.00000900, where a green band is marked on the daily candlestick chart and was last visited on April 26. This may serve as the next possible support as the wider market seems to correct the upward trend.
Technical indicators reinforce the bearish outlook. The Relative Strength Index (RSI) is positioned at 38, approaching oversold territory, while the MACD indicator is generating fresh bearish histogram bars, suggesting continued downward momentum.
Nonetheless, if geopolitical tensions in the Middle East subside, a stabilizing crypto market could help PEPE hold its ground above $0.00001000. In that event, the token may attempt a recovery toward the $0.00001196 level, marked by the May 17 low.


