Crypto Price Prediction: Bitcoin, Shiba Inu, and Ethereum Rebound from Key Support Levels

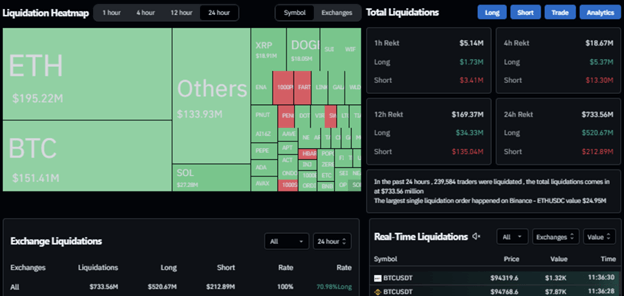
On Tuesday, Bitcoin (BTC) rose to about $95,500 after dropping below $90,000 on Monday. This early-week dip caused over $734 million in liquidations, with $152 million in BTC. Traders should be cautious as upcoming economic factors may increase BTC’s volatility.
Bitcoin’s price fell to $89,256 on Monday before returning to above $94,500, according to CoinGlass data. This correction led to a surge in liquidations, with over $734 million cleared, including $152 million in BTC.
Another factor revealed was the persistent weakening of institutional demand for Bitcoin. Crypto data firm CoinGlass reported $284.10 million in outflows from Bitcoin spot Exchange Traded funds (ETFs) on Monday, marking the exodus since January 8. These outflows present a potential threat to Bitcoin’s price if they continue or increase in the future.
Expert analysis came from Bitfinex, stating that higher US Treasury yields, which hit a 14-month high at 4.79%, pull institutional money out of risk assets such as BTC. They said that Bitcoin has a tradition of reacting fast to changes in yield. This time, the effect got worse with the new revelation that the US Department of Justice intends to sell off $6.5 billion worth of seized Bitcoins.
However, Bitcoin is still strong, having increased by 42 percent since the US Election in November, outperforming equity markets that gave back their post-election rally gains. However, considering the recent Fed’s signal to fewer interest rate cuts and firm financial conditions puts Bitcoin in a volatile realm in the short run.
Analysts working for Bitfinex also pointed at the possible positive news arising from the Trump presidency, which is expected to usher in friendly regulation of virtual currency. They said this could reduce further losses and support Bitcoin’s fundamental story.
A report by 10xResearch also notes that the Federal Reserve’s perspective is more significant for Bitcoin’s price than the next presidential administration. According to the report about inflation, which outweighs the inauguration, extra selling pressure will be put on Bitcoin before the US CPI data on Wednesday.
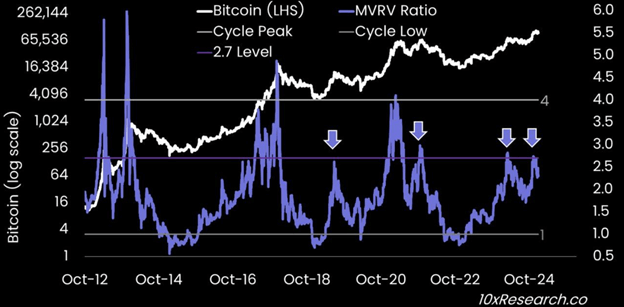
Head of Research at 10xResearch, Markus Thielen, assumed that cryptocurrency prices would probably remain in a ‘range-bound’ with average volatility until mid-2025. The report looked further at on-chain data pointing out that the profit-taking of smart money might be approaching. The latest MVRV ratio stands at 2.7x, which has coincided with profiting behaviors in previous times. Though the ratio has sometimes increased to 4x or 6x, and once touched 3.6x after crossing 2.5x, corrections or consolidations occurred on three of four such occasions at the 2.7x level.
Presumably, these market dynamics imply the presence of both now- and mid-term threats to Bitcoin and its steady remainder in the long-term evolution.
Bitcoin’s Price Analysis: Key Levels and Indicators to Watch
The report notes that Bitcoin’s price is still sensitive to macro factors and expectations that the Federal Reserve will continue a relatively tight monetary policy for several months. Furthermore, technical indicators cannot boast of achieving levels that would make risk-to-reward long position ratios healthy. Therefore, there is a big risk of BTC and other cryptos coming into contact with the downside targets, which could be between $76000 and $69000.
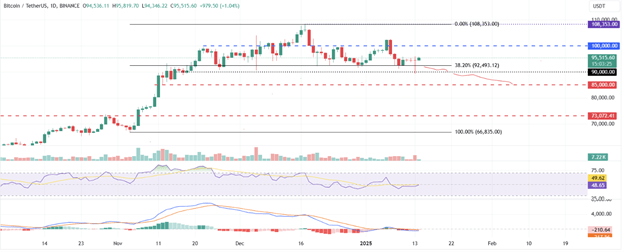
It dropped slightly, falling to $89,256, before temporarily stabilizing and rising slightly above $94,500 on Monday. The price as of Tuesday stands around $95,500, which indicates that there is some stability in the market.
If this correction continues and closes below the crucial level of $90,000, it will fall even further and reach the next support level at $85,000.
On the technical front, the Relative Strength Index (RSI) picture on the daily chart shows the alert of lack of directional movement near the middle band of the indicator at fifty. Indeed, on Wednesday, the MACD indicator also indicated a bearish crossover, meaning a sell signal, at least in the short term, to continue the current corrective phase.
On the other hand, if BTC bounces back closer to $100k or above, it will give a renewed bullish impulse, possibly back to a December 17, 2024, high of $108,353.
Shiba Inu (SHIB) Price Analysis: Key Support and Resistance Levels
Currently, on Tuesday, DOGE rival Shiba Inu (SHIB) is trading at $0.000021 after experiencing a substantial support area on Monday. For those investors who want to take SHIB into their portfolios, the levels of $0.000019-$0.000021 contain possible buying zones.
On Monday, the price of SHIB moved to a daily low to approach support of $0.000019. This support correlates to the 61.8% Fibonacci interference derived from the August 5 end of $0.000010 up to the December 8 top of $0.000033, a reversal point. Shib entered Tuesday a bit up, above the 200-day Exponential Moving Average (EMA) at $0.000021.
For the traders intending to start trading or invest, the range close to $0.000019 might be the right entry position.
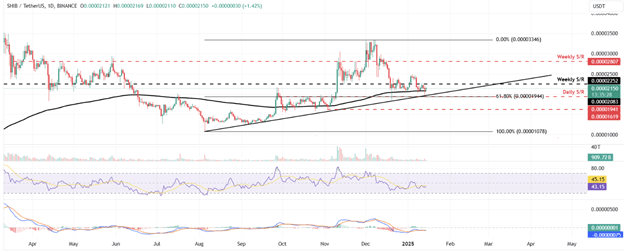
If the $0.000019 support level holds and SHIB successfully breaks above the weekly resistance of $0.000022, the token may extend the leg higher toward the next resistance level of $0.000028.
Leading Technical indicators give somewhat confusing signals. The Relative Strength Index on the daily chart is 44 below the 50 neutral mark, indicating a slightly bearish market. On the flip side, the Moving Average Convergence Divergence (MACD) signal illustrates that the token is hovering around the marginal ‘zero line’, meaning that traders are unsure of which way to turn.
On-Chain and Technical Indicators Highlight Key Levels for Shiba Inu (SHIB) Price
Several on-chain fundamentals might be favorable or bearish for the Shiba Inu’s price. Per IntoTheBlock’s data, around 17,160 wallets jointly bought 3.22 billion SHIB at an average price of $0.000021. This level is a crucial buy-back level since a price decline to this range will encourage many investors to accumulate more stocks, making it an important reversal level to watch.
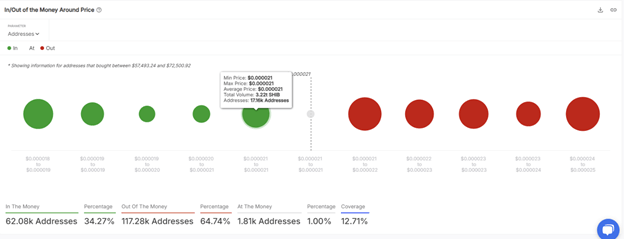
The support fluctuated between $0.000019 and $0.000021, supported by IOMAP analysis; this may be the turning point of SHIB’s price.
The information presented below, derived from Coinglass’s oI-weighted funding rate, reaffirms the elevated and optimistic outlook. This index, which compares the weighted averages of the futures contract yields, exhibits that the open interest rates of traders expecting a price rally outweigh those expecting a decline.
Currently, SHIB’s funding rate is 0.0103%, which means that long positions reward shorts. Conditions normally associated with bullish tendencies will likely mean upward pressure on the SHIB price.
However, there are still aspects that depict a bearish situation that could possibly occur in the future. This means that if the price of SHIB trades below the $0.000019 price mark, as seen on the daily chart, it will create a lower low, completely wiping out the bull thesis. Otherwise, they might lower it by 15% and bring it down to $0.000016, its price range on November 3.
These dynamics suggest that the next direction of the SHIB token should focus on levels and market sentiment.
Ethereum Rebounds with Renewed Bullish Momentum Amid Altcoin Surge
Altcoins are showing signs of an upward turn similar to Bitcoin in what could be pegged on the Ethereum revival after Bitcoin showcased exemplary growth in the last one day. Ethereum fell under $3,000 on Monday but has since reached $3,177 with a newer 8% increase.
Ethereum, with $Mcap/Fully Diluted around $383 billion and a daily trading volume of about $40 billion, closed on Monday on the Doji candle. That occurs when the Bollinger Bands’ upper and lower extremes trace this specific pattern, which may predict a bullish reversal in the short term. Further, another positive sign that came from Ethereum is the interaction on the daily chart that forms a bullish pattern continuation, boosting the trader’s optimism.
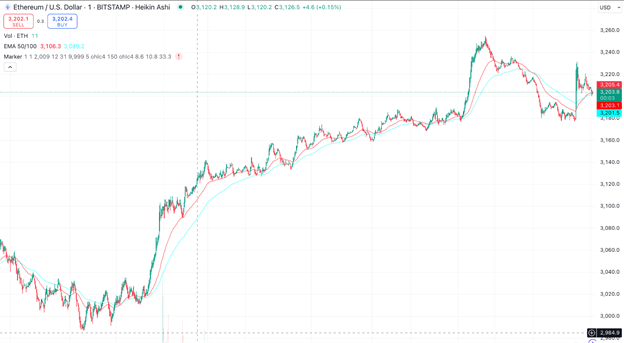
It has also resurrected from the 50-day Moving Average (MA) and is likely to scale toward its lifetime top. In addition, the macro time frame has presented the reversal of the Bitcoin dominance chart, suggesting that a likely “altseason” may occur in the following months.
Ethereum Whales Display Caution
However, owing to rising crypto market turbulence, Ether holders have demonstrated only lackadaisical interest in the past several days. The latest on-chain data shows that there has been a reduction of 9.32 % in newly registering active Ether addresses in the last week, which is currently at a hundred thousand.
Approximately six months after the approval of spot Ether Exchange-Traded Funds (ETFs), whales’ demand for Ether remained low from March 2024. From Coinglass data, the overall Ethereum on centralized exchange has increased by more than 400,000 since January 2025 and is estimated to be around 15,800,000 ETH.
At the same time, U.S. spot Ether ETFs recorded a fourth day of sequential net redemptions on Monday of around $39m. This takes approximately $2. 4 billion as the other net inflows to these ETFs and $10.8 billion as the overall net asset value. It was the only ETF in the Tai, not among the funds with a net outflow on Monday; on the contrary, it recorded a net inflow of $12.9m and total net assets of about $3.4 billion.
This content is not intended for U.S. or Canadian residents. We disclaim any liability for losses incurred based on the information provided.


