How To Read Crypto Candles in Charts? A Beginner's Guide for 2025

To effectively read candlesticks in candle charts, beginners should start by understanding basic candlestick formations. Each candlestick shows price movements, and the candle completely engulfs previous candles can indicate potential reversals. Focus on bullish candlesticks and common candlestick patterns for insights into market trends.
Candlestick charting was first developed in Japan in the 18th century by rice trader Munehisa Homma. He used it to track rice prices and noticed that emotional factors heavily influenced markets.
These insights eventually evolved into candlestick analysis, which was later introduced to Western traders by Steve Nison in the 1990s. Today, this ancient method is widely used in modern crypto trading.
Utilizing candlestick charts offers a visual representation of price action, allowing traders to look for patterns that can help in making informed decisions. Familiarize yourself with crypto candlestick patterns, such as the hammer candlestick, to spot larger bearish candles or bullish trends. The interpretation of candlesticks is crucial for successful trading crypto.
Recognizing recurring patterns in candlestick chart patterns enhances your ability to predict market movements. As you learn to read a crypto chart, pay attention to common patterns that emerge, as these patterns can help you navigate the volatile crypto landscape more effectively.
You may wonder about the meaning behind the green and red bars on a cryptocurrency chart. This guide clears everything from candlestick anatomy to deciphering key patterns, including how to read crypto candles in charts effectively.
The green and red bars, the candlestick, are the cornerstone of any crypto chart. In this article, we’ll learn how to interpret candlestick patterns and what they tell you about trading in your next crypto.
Cryptocurrency candlesticks reflect a coin’s price over a set time frame. Each candlestick covers some representation of the asset’s highs, lows, and opening and closing prices. We may see patterns that hint at future price trends as we view these candlesticks in succession.
What Are Candlesticks, and How To Read Crypto Candles?
Understanding candlesticks is crucial for crypto traders looking to navigate the crypto market. A candlestick represents price movement over a specific timeframe, with red candles indicating a close lower than the opening price and green candles showing a close higher than the opening price.
To read candlestick charts, observe the candlestick body and patterns in candlestick charts. For example, a bullish engulfing pattern suggests potential upward movement, while a doji candle may indicate indecision. Recognizing patterns like bearish candlesticks or a small green candle can help make more informed trading decisions.
Candlestick charts provide valuable insights into the trading range and high trading volume. By learning how to read candlestick patterns, traders can better identify patterns and utilize bar charts to spot potential market shifts. Candlestick charts help traders effectively analyze crypto assets and strategize their trades.
Anatomy of a Candlestick and Its Significance
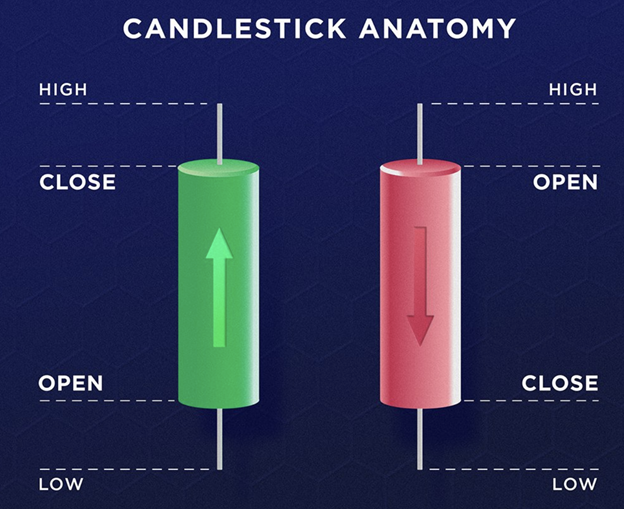
Candlesticks on crypto charts are composed of two main elements:
- The Body:
The candlestick is thicker in the middle, which is the asset’s opening and closing prices during the chosen time frame. Typically:
- If a period’s price increase is indicated with a green body, the price increased during that period.
- A red body means there’s been a price drop.
- The Wick (or Shadow):
The lines extending outward from the candlestick’s body show the highest and lowest prices from a period. The colour of the candlestick’s body usually wicks.
Why Traders Prefer Candlestick Charts
Many traders prefer candlestick charts to line charts as they provide in-depth information. Understanding how to read crypto candles in charts is essential for gaining insights into market trends. Each candlestick provides information about opening, closing, high, and low prices, making it easier to analyse an asset’s price movement. This detailed view highlights nuances such as:
- The closeness of the closing price to the high end of a period.
- The extent of price effects within particular trading periods.
They provide quicker information on market trends than line charts and help traders make better decisions.
How Candlesticks Can Analyze The Price Movements?
Candlesticks are central to technical analysis because they represent a detailed view of the price movement of crypto products. Because they can convey crucial market information, they’re a cornerstone of trading strategies.
What is Technical Analysis?
The studies performed in technical analysis concern chart patterns, trading volumes, and, in general, market-driven data that help you predict what will likely happen with the price. It gives the traders a decision on what will likely occur instead of what will likely be innovative.
Understanding how to read crypto candles in charts is crucial, as many popular cryptocurrency trading technical indicators rely on candlestick combinations displayed on a chart. Often, the patterns give traders clues about what will happen in the future, making candlesticks essential for traders.
Exploring Candlesticks: Key Concepts and Terminology
To appreciate the significance of candlestick patterns and technical analysis, you must become familiar with the terms and basic concepts that help you appreciate where they fit into overall technical analysis.
Bullish and Bearish Candlestick Pattern
At the heart of crypto trading lies a fundamental question: “The question then becomes, will the price rise or fall?” This is where you will find bullish and bearish candlestick patterns that will tell the trader how the price will go.
- Bullish Candlestick Patterns:
They occur behind a sequence of falling prices and usually indicate the start of a future price rise. Traders view them as indicators of a good market shift.
- Bearish Candlestick Patterns:
Some forms of these occur on the high side of an upward price trend, usually before a decline. They serve warnings about future price drops.
What’s important to see here is that the candlestick pattern’s bullish or bearish nature isn’t solely determined by its colour. Effects from price context cause each pattern to behave differently so that the same pattern can be bullish or bearish, depending on the price context in the chart.
Trading within the cryptocurrency market can be quite complex, and by learning to recognize these patterns, traders can develop tools to trade with more assurance.
Understanding Candlestick Patterns: Types and Indicators
Single- and Multiple-Candlestick Patterns
Specific individual candlesticks are deemed significant price trend shift indicators. These are referred to as single candlestick patterns.
Quite the opposite, actually. The majority of candlestick patterns are categorized as multiple-candlestick patterns. In order to efficiently read price movements, one must understand what configurations two or more consecutive candles have. Identifying these patterns is imperative to confirm market trends and dynamics.
Reversal and Continuation Candlestick Patterns
Candlestick patterns are usually based on a change in the price direction, i.e. whether an asset that is moving up from buyers could later turn north and reverse or marginally if it is declining from sellers, it could now increase. Reversal candlestick patterns are categorized.
However, not all patterns indicate a change of direction. Some candlestick patterns indicate the continuation of an asset’s price trend. Continuation candlestick patterns occur when these occur and are useful to traders who have to decide whether or not to continue with their existing investment strategy.
Key Indicators: Marubozus, Dojis, and Spinning Tops
The body of most candlesticks is distinct, and the wick is observable. Yet some candlesticks do look really visually distinct, and function as good signals for a possible trend reversal or continuation.
Marubozu Candlestick
And there’s one type of unique candlestick weirdly named the marubozu, or bald in Japanese. The distinctive feature of the body in this candlestick denotes that its opening and closing prices are equal to the highest and lowest prices during that period and absent of wick.
Doji Candlesticks
The doji is another nearly as important candlestick. It has a small body and a protruding wick, making it somewhat cross-like.
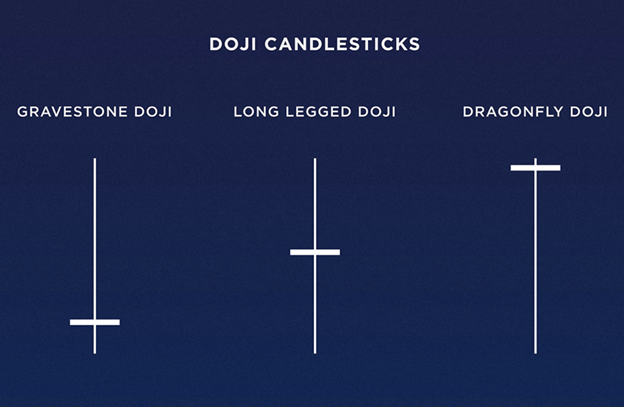
Doji occurs when an asset’s opening and closing prices are equal and irrelevant to price fluctuations within a time frame. The name comes from its characteristic or another way of describing an irregularity in price movement; doji means “mistake” in Japanese.
Dojis can be further categorized into:
Gravestone Doji: This is characterized by a body at the bottom of the candlestick.
Long-Legged Doji: A body in the middle of the candlestick: distinguished.
Dragonfly Doji: A body that is near the top of the candlestick.
When it comes to examining what lies behind these patterns and their various variations, these patterns are essential tools that traders who are attempting to decipher and predict market behaviour should not ignore.
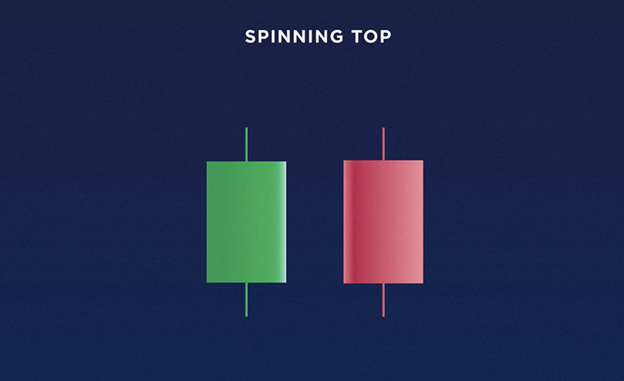
The Spinning Top Candlestick Pattern
A spinning top candlestick pattern looks like a doji, except the long wick is accompanied by a short body lodged in the middle. Derived from its likeness to a spinning top toy, its name. Unlike the doji, which typically indicates indecision, the spinning top has a small but noticeable body, representing small differences in price between the opening and closing during a period of large price changes.
Interpreting Candlestick Patterns: Bullish and Bearish Insights
The candlestick patterns will give out a clear bell of market sentiment, most lowly bullish and finally bullish. Nevertheless, the following examples are introductory and not a complete or definitive guide, so you can use them later as a foundation to help you understand further candlestick interpretations.
Bullish Single Candlestick Patterns
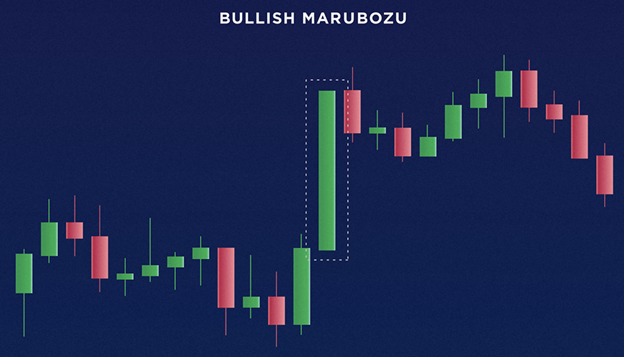
Bullish Marubozu
A marubozu candlestick, which has no wicks and a closing price higher than an opening price, is bullish. If this occurs, it means that traders are willing to buy an asset at virtually any price during the period. The marubozu is often a bullish formation signalling a possible continuation of an upward trend in a market.
Hammer
Hammer is one of the most distinctive bullish patterns. It features a small body up top, a long wick down below, and almost no upper wick. Sometimes, this candlestick develops after a chain of bearish ones, and in this case, it is considered a possible indicator for a bullish reversal.
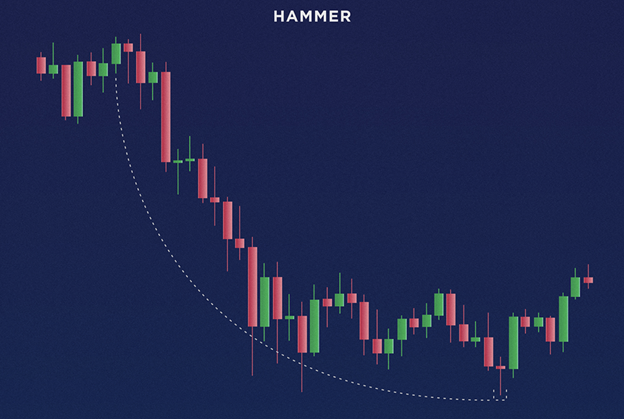
If we see a downtrend and we see a hammer, it means that opening and closing prices are very close to the price during that period, which is down. The potential for this formation to be the market turning a bottom and starting to reverse to an uptrend.
Single candlestick bullish patterns include the dragonfly doji and the bullish spinning top.
Bearish Single-Candlestick Patterns
Hanging Man
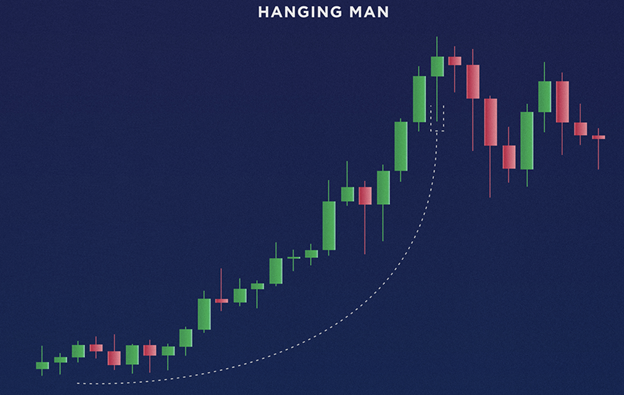
The hanging man, or hammer, also mirrors the hammer but occurs after a series of bullish candles. If the price of an asset peaks at this place, such a pattern may prove to be a reversal of a downtrend.
The hanging man also points out that pricing during the period was very limited, but there was a large downward fluctuation, which signifies weakening buying momentum. This pattern is sometimes interpreted as a precursor to the potential price decline.
Knowing these patterns helps you to understand how the market might want to move and how you can capitalize on the future price movement. These are just examples, and there’s no getting around that it takes a lot of practice and analysis to start getting the hang of candlestick interpretation.
Shooting Star Pattern
A shooting star is a bearish candlestick pattern seen after an upward price trend. The hanging man candlestick is an inverted version of this. It has a small body, little to no lower wick, and a much longer upper wick, resulting in a star dropping its path behind it.
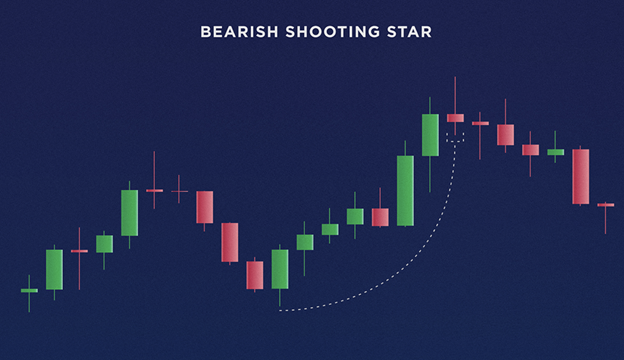
A shooting star occurs after a run of bullish candles. In this case, the closing price was virtually unchanged compared with the end of the trading period, but the price rose to higher levels during that period. However, this may mean further price resistance or even a downward price movement.
Other single candlestick patterns, such as the bearish gravestone doji, bearish spinning top, and marubozu, may be read as bearish.
Bullish Patterns in Multi-Candlestick Configurations
Traders use single candlestick patterns and combinations of two or more candlesticks to predict market price movements. Learning how to read crypto candles in charts can help traders identify these multi-candlestick patterns, often providing hints of potential bullish or bearish trends.
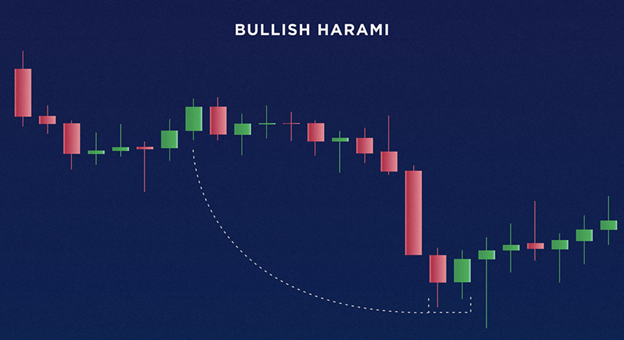
Bullish Harami
The bullish harami is a two-candle pattern, consisting of a first bearish candle larger than a second bullish candle that stays within the first candle’s body. Harami is the Japanese word for pregnant, and it is considered a candlestick pair because of how it looks since that is a pregnant figure. This pattern can also sign a trend reversal, which implies a sharp price drop and then a small bounce, often approaching the same price that triggered the dropout.
Many other bullish multiple candlestick patterns contain 3 or more candlesticks and reveal other market behaviour indicators.
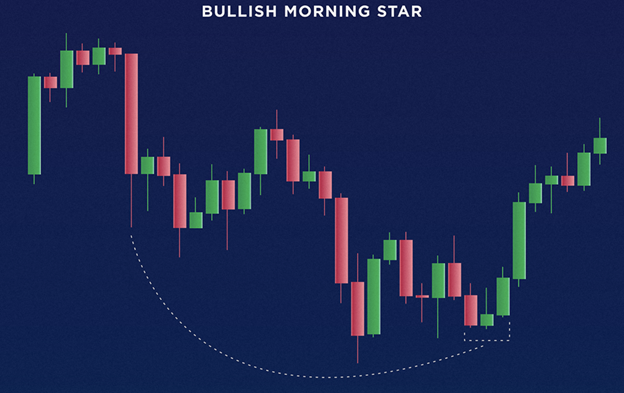
Morning Star
The morning star pattern is a three-candle stick pattern consisting of a bearish candle, a doji, and a bullish candle. The middle of the doji is a time when prices are not moving much at all (while still moving quite a bit), and we’ve reached a point of market indecision. If you follow this pattern, it will often be interpreted as a signal regarding a trend reversal from bearish to bullish.
Bullish multi-candlestick patterns include the bullish kicker, bullish engaging, piercing line, tweezer bottom, bullish aborted baby, three white soldiers, three inside up, three outside up, etc.
This is to let you know that multi-candlestick formations can also be used as indicators of a potential bearish trend. Sometimes, they indicate a downward shift from a bullish trend to a fall in price.
Bearish Engulfing Pattern
A bearish engulfing pattern is a two-candlestick configuration that’s the opposite of a bullish harami pattern. The first candle is a bullish candle of course followed by a bearish candle, which over tops the previous candle. This pattern is typically formed after a bullish price trend, meaning that a minor price increase that was on its way has experienced a stronger bearish momentum in a slight downtrend.
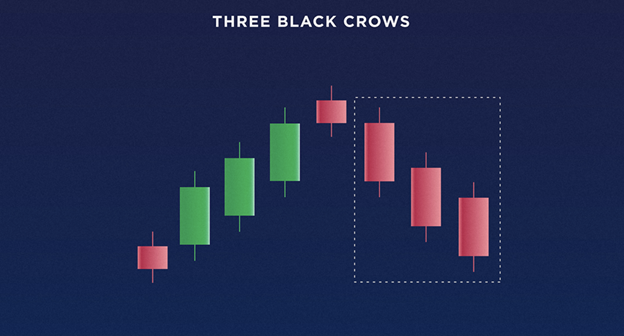
Three Black Crows
The three black crows’ pattern consists of three bearish candles with similar wide bodies and short wicks. Often, these candles overlap in their opening and closing price ranges as well. When this pattern follows a bullish trend, it may suggest that something is flipping, showing diminishing growth of the asset.
Other bearish multiple candlestick patterns include bearish kicker, bearish harami, evening star, dark cloud cover, tweezer top, bearish abandoned baby, three inside down, three outside down and more.
Knowledge of and application of candlestick patterns in trading gives meaning to market trends and potential price movements and leads traders to make informed trading decisions.
FAQ
What is the 3 candle rule?
The 3 candle rule is a trading strategy used in trading that relies on specific candlestick patterns. A candlestick pattern is the bullish formation that indicates a potential price reversal. Candlestick charts visually represent market sentiment, with each candlestick indicating price movement over a specific period.
Traders analyze candlestick charts showing sequences of three candles to identify entry and exit points. The first two candles set up the trend, while the third candle confirms the bullish momentum. This technique enhances decision-making by visually summarizing price action.
How do you read crypto charts accurately?
To read crypto charts accurately, it’s essential to understand the tools used in trading. Candlestick charts showing price movements provide valuable insights into market trends. Each candlestick indicates the open, close, high, and low prices for a specific time frame.
One important candlestick pattern is the bullish pattern, which suggests a potential upward price movement. By analyzing these patterns, traders can make informed decisions based on the visual representation of market sentiment.
How do you read a crypto bar chart?
To effectively read crypto signals, start with the use of candlestick charts that visually represent price movements. These trading charts show how candlestick patterns work, helping you identify trends. A candlestick that closes higher can indicate bullish sentiment, aligning with your trading strategy.
Mastering candlestick patterns is essential in your crypto trading journey. For instance, a candlestick pattern that is the bullish signals potential upward movement. Leveraging the power of candlestick analysis can enhance your understanding of price action on various crypto exchanges, ultimately improving your trading success.
How to read crypto signals?
To effectively read crypto signals, start by understanding how candlestick patterns work. The use of candlestick charts is crucial, as they visually represent price movements over time. Look for a candlestick pattern that is the bullish signal, which can indicate potential upward trends.
Mastering candlestick analysis helps align your findings with your trading strategy. When a candlestick that closes near its high appears, it often indicates bullish sentiment. Utilize trading charts from various crypto exchanges to enhance your crypto trading journey and make informed decisions.


